Auto Market Structure & Liquidity
Structure, the level that would change it, how far the leg has retraced, and where it traded.
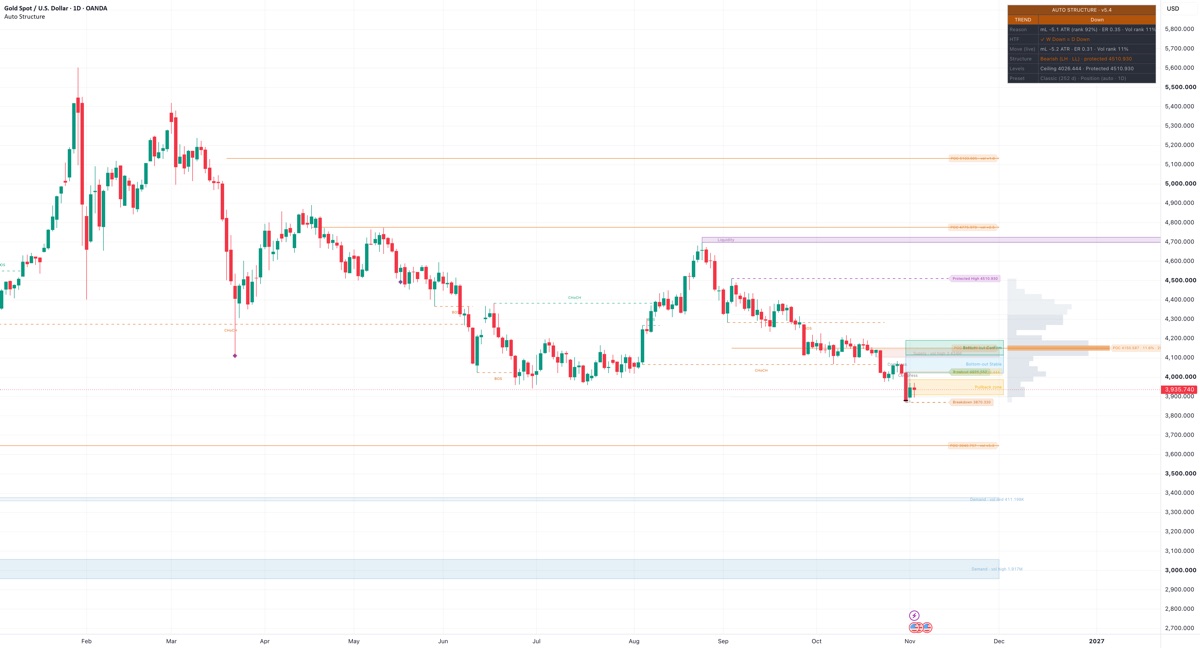
What it draws
- BOS and CHoCH, dashed from the broken swing to the break
- Protected High or Protected Low, dashed
- Fibonacci levels on the structure leg, grey dotted
- 61.8% golden ratio, solid gold
- Bottom-out Stable, 23.6–38.2% of a down leg
- Bottom-out Confirm, 38.2–50% of a down leg
- Liquidity zones beyond recent pivots, ◆ marks a sweep
- Pullback zone with its Floor or Ceiling
- Demand order block with its volume, low / mid / high
- Supply order block with its volume, low / mid / high
- Leg volume profile, rows right of price, value area dotted
- POC of the leg, and Smart POC levels of finished legs
How it works
Swings are confirmed once price reverses a set multiple of ATR(14), 2.0 by default, so swing highs and lows always alternate. A close beyond the last swing marks a BOS, and the swing on the other side becomes the Protected level. A close beyond the Protected level marks a CHoCH and turns the structure. A Fibonacci retracement is drawn on the same leg, from the Protected level (100%) to the extreme since it (0%), with 61.8% in gold. In a Bearish structure two Bottom-out areas are shaded on that leg as recovery-depth marks, measured up from the low: Stable at 23.6–38.2% and Confirm at 38.2–50% of the leg. They are depth marks, not Fibonacci support. Liquidity zones sit just beyond recent unswept pivot highs and lows. When the symbol has volume, three volume layers follow the same structure: order blocks mark the last opposite candle before each BOS or CHoCH move, with the volume traded inside it; the leg volume profile shows volume at price from the Protected level to the last bar, with its POC and 70% value area; and Smart POC levels keep the POC of each finished swing leg whose volume was at least the recent average. A dashboard reads the market state as TREND, READY or WAIT from momentum, path efficiency and volatility, each ranked against about one year of the same market.
How to use
Set Market first: Classic, Crypto, FX & Gold or Custom trading days per year. Leave Style on Auto unless slower or faster states are wanted, and check the Preset row. Read the Structure row together with the Protected level: while closes stay on its side, the structure is unchanged. On a down leg, the Bottom-out areas describe how much of the leg has been recovered from its low; they are depth marks, not Fibonacci support. The volume layers show where the leg traded most; they are reference levels, not turning points. States, BOS, CHoCH, sweeps and alerts are set on closed bars; the Fibonacci 0% level and the ✓ marks follow the live bar until it closes.
What it does not do
- It does not give signals or place orders. TREND, READY, WAIT, BOS, CHoCH and the ✓ marks describe the chart, not what to do.
- It does not forecast. The Bottom-out areas are depth marks on the current down leg, not Fibonacci support, and neither they nor the golden ratio are tested signals. Order blocks, the POC and Smart POC levels show where price traded, not where it will turn.
- It does not suit Heikin Ashi, Renko or other non-standard charts. Swings, breaks and sweeps assume standard candles.
Manual
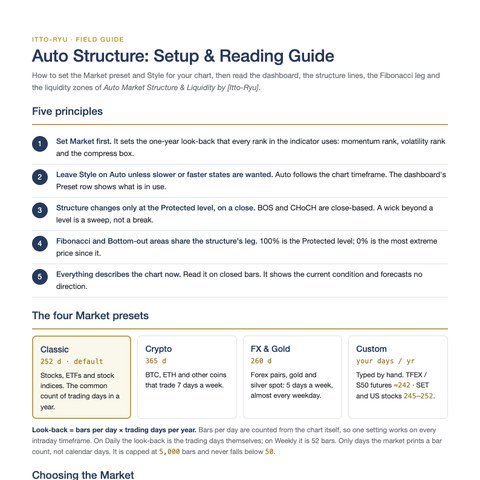
Setup & Reading Guide
How to set the Market preset and Style, then read the dashboard and its 12 states, the BOS / CHoCH structure with its Protected level, the Fibonacci leg with the Bottom-out areas, and the liquidity zones. Six pages with preset cards, a Market and Style chooser, a drawings legend and a Fibonacci diagram.
Five principles
- Set Market first: it sets the one-year look-back behind every rank.
- Leave Style on Auto unless slower or faster states are wanted; the Preset row shows what is in use.
- Structure changes only at the Protected level, on a close. A wick beyond it is a sweep, not a break.
- Fibonacci lines and Bottom-out areas share the structure leg: 100% is the Protected level, 0% the extreme since it. The Bottom-out areas are recovery-depth marks, not Fibonacci support.
- Everything describes the chart now. Read it on closed bars; it forecasts no direction.
Market presets
- Classic
- 252 days · stocks, ETFs, indices
- Crypto
- 365 days · 7-day markets
- FX & Gold
- 260 days · forex, gold, silver
- Custom
- your days · e.g. TFEX ≈ 242
PDF · 6 pages · 520 KB · For education only. Not investment advice.
Reading the states
Pick a part of the chart, then a word or mark the tool shows there, to see what it measures in technical terms.Each word or mark the tool shows, grouped by the part of the chart where it appears.
Where on the chart
What it shows
TREND
dashboard table, state row, left cell
Uptrend or downtrend
- What it measures
- The group of the state beside it: Up, Down, Breakout Up, Breakdown, Sideways Up or Sideways Down. Header and state row turn green (up) or orange-red (down). Set on closed bars; the forming bar shows the last closed state.
- What it does not mean
- Not a signal. The group names the kind of market on the last closed bar.
- Check yourself
- Which state sits beside it, and does the Structure row agree?
Up
dashboard table, state row, right cell
Uptrend
- What it measures
- Clean path and strong momentum: smoothed Efficiency Ratio 0.30 or more and slow-momentum rank 66% or more over the look-back (on until ER drops below 0.25 or rank below 60%), with slow momentum at or above zero. Closed bars only.
- Technical setup
- Trend continuation. Technicians often wait for a pullback into the Pullback zone rather than chasing the move, and frame risk beyond the Protected level or as an ATR multiple.
- What it does not mean
- Not a forecast. It describes how straight and strong the recent path was.
- Check yourself
- Does the Structure row read Bullish, and what does the HTF row show?
Down
dashboard table, state row, right cell
Downtrend
- What it measures
- Clean path and strong momentum: smoothed Efficiency Ratio 0.30 or more and slow-momentum rank 66% or more over the look-back (on until ER drops below 0.25 or rank below 60%), with slow momentum below zero. Closed bars only.
- Technical setup
- Trend continuation. Technicians often wait for a bounce into the Pullback zone rather than chasing the move, and frame risk beyond the Protected level or as an ATR multiple.
- What it does not mean
- Not a forecast. It describes how straight and strong the recent path was.
- Check yourself
- Does the Structure row read Bearish, and what does the HTF row show?
Breakout Up
dashboard table, state row, right cell
Uptrend, leaving a compress box
- What it measures
- A closed bar ended above the top of a compress box of 3 bars or more, while the box was live (10 bars after it ends in Swing style), with fast momentum up and ER 0.30 or more. Kept 3 bars in Swing style and skips the hold rules.
- Technical setup
- Volatility expansion after compression. Technicians often wait for a retest of the Breakout line or a first pullback that holds above it, and frame risk below the box or as an ATR multiple.
- What it does not mean
- Not a promise the move continues; the state ends after its hold bars.
- Check yourself
- Did the close clear the box clearly, or only just?
Breakdown
dashboard table, state row, right cell
Downtrend, leaving a compress box
- What it measures
- A closed bar ended below the bottom of a compress box of 3 bars or more, while the box was live (10 bars after it ends in Swing style), with fast momentum down and ER 0.30 or more. Kept 3 bars in Swing style and skips the hold rules.
- Technical setup
- Volatility expansion after compression. Technicians often wait for a retest of the Breakdown line from below or a first bounce that stalls under it, and frame risk above the box or as an ATR multiple.
- What it does not mean
- Not a promise the move continues; the state ends after its hold bars.
- Check yourself
- Did the close clear the box clearly, or only just?
Sideways Up
dashboard table, state row, right cell
Leaning up
- What it measures
- Trend conditions are off, but momentum rank is 33% or more (off below 28%) and the path is not choppy. The side comes from the state machine's trend memory, or from slow momentum when there is none. Swing High / Low lines show.
- Technical setup
- A weak or fading move. Technicians often treat it as a transition and wait for Up, or a pullback that holds, before reading an uptrend.
- What it does not mean
- Not a range. Price is moving, but not cleanly enough for a trend reading.
- Check yourself
- Is it rising out of WAIT, or fading from Up?
Sideways Down
dashboard table, state row, right cell
Leaning down
- What it measures
- Trend conditions are off, but momentum rank is 33% or more (off below 28%) and the path is not choppy. The side comes from the state machine's trend memory, or from slow momentum when there is none. Swing High / Low lines show.
- Technical setup
- A weak or fading move. Technicians often treat it as a transition and wait for Down, or a bounce that stalls, before reading a downtrend.
- What it does not mean
- Not a range. Price is moving, but not cleanly enough for a trend reading.
- Check yourself
- Is it falling out of WAIT, or fading from Down?
READY
dashboard table, state row, left cell
Mixed, a pause inside or before a move
- What it measures
- The group of Pullback Up, Pullback Down and Compressed. Blue header and state row. A group change needs 3 bars in the new group, unless Volatile or Breakout takes over. Closed bars only.
- What it does not mean
- Not a ready-to-act signal. The name describes a pause.
- Check yourself
- Is this a pullback inside a held trend, or compression?
Pullback Up
dashboard table, state row, right cell
Uptrend, in a pullback
- What it measures
- The state machine still holds an up trend from Up or Breakout Up, fast momentum is below zero (or the state was already on), and the close sits between the Pullback Floor and the top of the Pullback zone: 0.5 to 2.0 ATR below the trend high with Mid ATR.
- Technical setup
- A pullback in an uptrend. Technicians often wait for a close back up from the zone, and frame risk beyond the Pullback Floor or the Protected Low, or as an ATR multiple.
- What it does not mean
- Not that the pullback is over. A close below the Floor clears the trend memory.
- Check yourself
- Is the close nearer the zone or the Floor?
Pullback Down
dashboard table, state row, right cell
Downtrend, in a bounce
- What it measures
- The state machine still holds a down trend from Down or Breakdown, fast momentum is above zero (or the state was already on), and the close sits between the Pullback Ceiling and the bottom of the Pullback zone: 0.5 to 2.0 ATR above the trend low with Mid ATR.
- Technical setup
- A bounce in a downtrend. Technicians often wait for a close back down from the zone, and frame risk beyond the Pullback Ceiling or the Protected High, or as an ATR multiple.
- What it does not mean
- Not that the bounce is over. A close above the Ceiling clears the trend memory.
- Check yourself
- Is the close nearer the zone or the Ceiling?
Compressed
dashboard table, state row, right cell
Sideways or chop, compressed
- What it measures
- Volatility rank (ATR over the look-back) is in its lowest 10%, on until it rises above 15%, and trend conditions are off. A grey Compress box is drawn while volatility stays compressed.
- Technical setup
- Volatility contraction. Technicians often mark the box edges and wait for a close outside with a clean move, the condition for Breakout Up or Breakdown.
- What it does not mean
- Not a direction. A compressed market can leave on either side.
- Check yourself
- Where are the Breakout and Breakdown lines?
WAIT
dashboard table, state row, left cell
Sideways or chop
- What it measures
- The group of Chop, Volatile and Neutral. Orange header and state row; Swing High, Swing Low and Mid lines show. A group change needs 3 bars in the new group, unless Volatile or Breakout takes over.
- Technical setup
- Technicians often set trend methods aside here and read the market by its Swing High and Swing Low.
- What it does not mean
- Not a reversal; the next trend reading can be on either side.
- Check yourself
- Which WAIT state is it: Chop, Volatile or Neutral?
Chop
dashboard table, state row, right cell
Sideways or chop
- What it measures
- No clean path: smoothed ER below 0.25 (on until it reaches 0.30) and trend conditions off. Switching between Chop and Neutral needs 3 bars.
- Technical setup
- A range or noisy market. Technicians often read it by its edges, the Swing High and Swing Low, and wait for a cleaner path before reading a trend.
- What it does not mean
- Not low volatility; price can swing widely without a clean path.
- Check yourself
- Is the Vol rank in the Move row high or low?
Volatile
dashboard table, state row, right cell
Mixed, very volatile
- What it measures
- Volatility rank 90% or more (on until below 85%) with no clean path (ER below 0.25). Skips the hold rules and clears the state machine's trend memory.
- Technical setup
- A disorderly market. Technicians often widen any ATR-based risk frame, or stand aside until volatility settles.
- What it does not mean
- Not a direction, and not a sign that a move is ending.
- Check yourself
- How high is the Vol rank in the Reason row?
Neutral
dashboard table, state row, right cell
Mixed
- What it measures
- None of the other states applies, for example momentum too weak for Sideways while the path is not choppy. Often early in a turn. Switching between Neutral and Chop needs 3 bars.
- What it does not mean
- Not a calm market; it is what is left when no other rule fits.
- Check yourself
- Has the Structure row changed recently?
— warming up
dashboard table, state row
No reading
- What it measures
- Not enough history yet to rank momentum and volatility over the look-back, about one year of bars (50 to 5,000). The group cell shows —, State-mode candles keep chart colours, and no group alert fires on the first state after it.
- What it does not mean
- Not a quiet market. The tool cannot read yet.
- Check yourself
- Is enough history loaded for this timeframe?
Bullish (HH · HL) · protected [price]
dashboard table, Structure row
Uptrend by structure
- What it measures
- The last break was up: a close above a swing high (BOS) or the Protected High (CHoCH). HH or LH compares the last two swing highs, HL or LL the last two lows, from the ATR zigzag (2.0 × ATR). Other pairs can print while still Bullish. Green text.
- Technical setup
- Trend continuation by Dow structure. Technicians often watch pullbacks that hold above the Protected Low, and frame risk beyond it or as an ATR multiple.
- What it does not mean
- Not a forecast. Bullish stays until a close below the Protected Low, however far price falls before that.
- Check yourself
- Do the swing pairs read HH · HL, or is one against it?
Bearish (LH · LL) · protected [price]
dashboard table, Structure row
Downtrend by structure
- What it measures
- The last break was down: a close below a swing low (BOS) or the Protected Low (CHoCH). HH or LH compares the last two swing highs, HL or LL the last two lows, from the ATR zigzag (2.0 × ATR). Other pairs can print while still Bearish. Orange-red text.
- Technical setup
- Trend continuation by Dow structure. Technicians often watch bounces that stall below the Protected High, and frame risk beyond it or as an ATR multiple.
- What it does not mean
- Not a forecast. Bearish stays until a close above the Protected High, however far price rises before that.
- Check yourself
- Do the swing pairs read LH · LL, or is one against it?
— (—)
dashboard table, Structure row
No reading
- What it measures
- No structure break yet on the loaded history, so neither Bullish nor Bearish; grey text. (—) alone means fewer than two confirmed swing highs or lows, and can also follow Bullish or Bearish early in the history.
- What it does not mean
- Not a range reading. The structure has not started yet.
- Check yourself
- Is enough history loaded, or is Swing size very large?
✓ [HTF] Up = [chart] Up
dashboard table, HTF row
Uptrend, timeframes agree
- What it measures
- The higher timeframe (1H for 15m or less, 4H up to 1H, D up to 4H, W up to D, M above) is read on its last closed bar: momentum up over the slow look-back, ranked 33% or more on its own history, and the chart's state points up (Up, Breakout Up, Sideways Up or Pullback Up). Green text.
- Technical setup
- Multi-timeframe agreement. Technicians often give more weight to a trend reading when the slower timeframe points the same way.
- What it does not mean
- Not confirmation of a move ahead; it compares two readings.
- Check yourself
- When does the current higher-timeframe bar close?
✓ [HTF] Down = [chart] Down
dashboard table, HTF row
Downtrend, timeframes agree
- What it measures
- The higher timeframe (1H for 15m or less, 4H up to 1H, D up to 4H, W up to D, M above) is read on its last closed bar: momentum down over the slow look-back, ranked 33% or more on its own history, and the chart's state points down (Down, Breakdown, Sideways Down or Pullback Down). Orange-red text.
- Technical setup
- Multi-timeframe agreement. Technicians often give more weight to a trend reading when the slower timeframe points the same way.
- What it does not mean
- Not confirmation of a move ahead; it compares two readings.
- Check yourself
- When does the current higher-timeframe bar close?
⚠ [HTF] Down vs [chart] Up, or ⚠ [HTF] Up vs [chart] Down
dashboard table, HTF row
Mixed, timeframes disagree
- What it measures
- The higher timeframe (1H for 15m or less, 4H up to 1H, D up to 4H, W up to D, M above) is read on its last closed bar. Its momentum, ranked 33% or more, points the other way from the chart's state. Orange text.
- Technical setup
- Timeframe conflict. Technicians often read the chart's move as a pullback or bounce inside the bigger move until the slower timeframe turns.
- What it does not mean
- Not a reversal call on either timeframe.
- Check yourself
- Which timeframe does my own analysis start from?
[HTF] flat · [chart] Up, or [HTF] Up · [chart] no trend (grey)
dashboard table, HTF row
No reading
- What it measures
- Grey text when the higher timeframe's momentum rank is below 33% (flat), or the chart's state has no side: Compressed, a WAIT state or warming up.
- What it does not mean
- Not a conflict; one side has nothing to compare.
- Check yourself
- Which side is grey: the higher timeframe or this chart?
[HTF] n/a — not enough history
dashboard table, HTF row
No reading
- What it measures
- The higher timeframe has no ranked value yet, or is not higher than the chart, for example on a monthly chart. Grey text.
- What it does not mean
- Not a flat higher timeframe; there is no value to read.
- Check yourself
- Is this chart already on the highest step?
Reason: mL [x] ATR (rank [n]%) · ER [x] · Vol rank [n]%
dashboard table, Reason row
Not a trend reading
- What it measures
- The three inputs behind the state on the last closed bar: smoothed slow momentum in ATR and its rank over the look-back, smoothed Efficiency Ratio (0 = noise, 1 = straight line) and the rank of ATR.
- What it does not mean
- Not scores to compare across markets; ranks are within this symbol and timeframe.
- Check yourself
- Which of the three values moved the state?
Next 10 bars: range ≈ [a] – [b]
dashboard table, Next 10 bars row
Not a trend reading
- What it measures
- Off by default. A range band from ATR(14) of the last closed bar, as price distances, for the high-to-low span of the next 10 bars. It gives width, not direction.
- Technical setup
- Volatility sizing. Technicians often compare a risk frame or a range's height with this band to judge whether it is normal for the market.
- What it does not mean
- Not price levels and not a direction; two widths only.
- Check yourself
- Is my own risk frame small or large next to this band?
Move (live): mL [x] ATR · ER [x] · Vol rank [n]%
dashboard table, Move (live) row
Not a trend reading
- What it measures
- The same three values as Reason, from the forming bar, so they change until it closes. The state only follows them once the bar has closed.
- What it does not mean
- Not the state; a live preview of its inputs.
- Check yourself
- Has the bar closed yet?
Levels: Floor [price] · Protected [price], Ceiling [price] · Protected [price], or Swing H [price] · L [price]
dashboard table, Levels row
Not a trend reading
- What it measures
- While the state machine holds a trend: the Pullback Floor (up) or Ceiling (down), and the structure's Protected level; the two come from separate engines. With no trend memory: highest high and lowest low of the swing look-back (20 bars in Swing style).
- Technical setup
- Technicians often frame risk beyond one of these levels, or as an ATR multiple, and read a range by Swing H and L.
- What it does not mean
- Not stop prices chosen by the tool; reference levels only.
- Check yourself
- Which level is nearer the close?
Preset: [Market] ([n] bars/day × [d] d) · [Style] (auto · [TF])
dashboard table, Preset row
Not a trend reading
- What it measures
- The Market and Style in use. Bars per day are counted from the chart and shown on intraday charts only; (auto · …) appears when Style is Auto, with the raw timeframe code, such as 60.
- What it does not mean
- Not a reading of the market; a settings check.
- Check yourself
- Does this match the market on my chart?
BOS (green or orange-red dashed line)
price chart
Uptrend or downtrend by structure, continuing
- What it measures
- A closed bar ended beyond the last swing in the structure's direction, or the first break. A wick is not a break. The line runs from the swing to the break bar: green with text above when up, orange-red with text below when down. Moves the Protected level. Last 12 kept.
- Technical setup
- Trend continuation by structure. Technicians often wait for a pullback after a BOS, and frame risk beyond the new Protected level or as an ATR multiple.
- What it does not mean
- Not drawn in real time: the swing is confirmed only after a 2 × ATR reversal, then a close beyond it.
- Check yourself
- How far did the close go beyond the swing?
CHoCH (green or orange-red dashed line)
price chart
Change of structure, either side
- What it measures
- A closed bar ended beyond the Protected level, against the structure. Bullish becomes Bearish (orange-red, text below) or the reverse (green, text above). The line runs from the Protected level's bar to the break bar.
- Technical setup
- A possible change of trend. Technicians often wait for a BOS in the new direction before reading a new trend, and frame risk beyond the new Protected level.
- What it does not mean
- Not a confirmed new trend; one close beyond one level.
- Check yourself
- Has a BOS in the new direction followed yet?
Protected Low [price] (magenta dashed line)
price chart
Uptrend by structure, the level that holds it
- What it measures
- In a Bullish structure: the lowest low from the broken swing high to the break bar, reset at each upward BOS; after a CHoCH up, the lowest low since the old Protected High. A close below it is a CHoCH. The line starts at that low's bar.
- Technical setup
- Technicians often frame risk beyond the Protected Low, as the level whose loss changes the structure.
- What it does not mean
- Not a level price must hold; a wick below does not count, only a close.
- Check yourself
- How far is the close from this line, in ATR?
Protected High [price] (purple dashed line)
price chart
Downtrend by structure, the level that holds it
- What it measures
- In a Bearish structure: the highest high from the broken swing low to the break bar, reset at each downward BOS; after a CHoCH down, the highest high since the old Protected Low. A close above it is a CHoCH. The line starts at that high's bar.
- Technical setup
- Technicians often frame risk beyond the Protected High, as the level whose loss changes the structure.
- What it does not mean
- Not a level price must stay under; a wick above does not count, only a close.
- Check yourself
- How far is the close from this line, in ATR?
Fib 0% (swing high) [price] or Fib 0% (swing low) [price]
price chart
Not a trend reading
- What it measures
- The most extreme price since the Protected level: the highest high in a Bullish structure, the lowest low in a Bearish one, including the forming bar, so it can move until the bar closes. Grey dotted line from the Protected level's bar.
- What it does not mean
- Not a confirmed swing; it follows each new extreme. A fixed convention, untested as a signal.
- Check yourself
- Did the forming bar just set this level?
Fib 100% (protected low) [price] or Fib 100% (protected high) [price]
price chart
Not a trend reading
- What it measures
- The same price as the Protected level, the anchor of the leg. The whole leg moves to a new anchor after each BOS or CHoCH.
- What it does not mean
- Not a separate level; it repeats the Protected line. A fixed convention, untested as a signal.
- Check yourself
- When did the anchor last move?
Fib 23.6%, Fib 38.2%, Fib 50%, Fib 78.6% [price] (grey dotted lines)
price chart
Not a trend reading
- What it measures
- Retracements of the same leg, measured back from 0%: down from the high in a Bullish structure, up from the low in a Bearish one. Rebuilt on the latest bar only.
- Technical setup
- Retracement framing. Technicians often watch whether a pullback stalls between 38.2% and 61.8%, and look for structure to agree before reading anything.
- What it does not mean
- Fixed Fibonacci conventions, untested as signals. Not support or resistance the tool found.
- Check yourself
- Does a level line up with a swing I marked myself?
Fib 61.8% (golden ratio) [price] (solid gold line)
price chart
Not a trend reading
- What it measures
- The 61.8% retracement of the same leg, drawn thicker and in gold.
- Technical setup
- Many technicians watch the 61.8% retracement as the deep end of a normal pullback, and look for structure to agree before reading anything.
- What it does not mean
- A fixed convention, untested as a signal; not a turning point.
- Check yourself
- Is the Protected level far beyond this line or close to it?
Bottom-out Stable (light blue box)
price chart, Bearish structure only
Not a trend reading
- What it measures
- 23.6–38.2% of the down leg recovered, measured up from its low, on the structure leg from the Protected High. The box runs from the low's bar to the right edge. Shown only in a Bearish structure.
- What it does not mean
- Not a bottom call and not Fibonacci support: a recovery-depth mark, untested as a signal; the structure changes only at the Protected High.
- Check yourself
- Where is the close relative to the box?
Bottom-out Stable ✓
price chart, Bearish structure only
Not a trend reading
- What it measures
- The last close, forming bar included, is above the top of the Stable area (38.2% of the leg). The ✓ can come and go until the bar closes.
- Technical setup
- Retracement framing. Technicians often treat a partial recovery of a down leg as a description only, and wait for a CHoCH at the Protected High before reading a change.
- What it does not mean
- Not a signal and not a structure change. A recovery-depth mark, untested as a signal.
- Check yourself
- Has the bar closed, and where is the Protected High?
Bottom-out Confirm (green box)
price chart, Bearish structure only
Not a trend reading
- What it measures
- 38.2–50% of the same down leg, directly above the Stable area, from the low's bar to the right edge. Shown only in a Bearish structure.
- What it does not mean
- Not a confirmed bottom despite the name, and not Fibonacci support: a recovery-depth mark, untested as a signal.
- Check yourself
- How far is the box from the Protected High?
Bottom-out Confirm ✓
price chart, Bearish structure only
Not a trend reading
- What it measures
- The last close, forming bar included, is above the top of the Confirm area (50% of the leg). The ✓ can come and go until the bar closes.
- Technical setup
- Retracement framing. Technicians often treat a half recovery of a down leg as a description only, and wait for a CHoCH at the Protected High before reading a change.
- What it does not mean
- Not a signal and not a structure change; the structure is still Bearish. A recovery-depth mark, untested as a signal.
- Check yourself
- Has the bar closed, and where is the Protected High?
Liquidity (thin purple zone)
price chart, beyond a swing high or low
Not a trend reading
- What it measures
- A zone 0.25 × ATR deep just above a pivot high or below a pivot low (5 bars each side in Swing style), drawn from the pivot bar once confirmed and extended right. The last three unswept zones each side are kept.
- Technical setup
- Liquidity framing. Technicians often watch how price behaves at a prior swing: a close through it, or a wick through and a close back.
- What it does not mean
- Not proof that orders sit there; it marks a prior swing extreme.
- Check yourself
- Has price reached this zone yet?
Liquidity ×2 (darker purple zone)
price chart, beyond a swing high or low
Not a trend reading
- What it measures
- A new pivot within 0.1 × ATR of an existing zone merges into it: the zone keeps the more extreme price and counts the pivots (×2, ×3 …). Darker shade.
- Technical setup
- Technicians often note repeated swings at a similar price, and watch for a close through the level or a sweep.
- What it does not mean
- Not a stronger level by any test; it counts pivots at a similar price.
- Check yourself
- How many times has price turned here?
◆ (purple diamond)
price chart, at the bar's high or low
Not a trend reading
- What it measures
- On a closed bar, the wick went beyond a liquidity zone's swing price and the close came back inside: a sweep. The zone is removed. A close beyond the price removes the zone too, without ◆. Last 30 kept.
- Technical setup
- Sweep-and-reclaim framing. Technicians often wait for the next bars to confirm the rejection, and frame risk beyond the wick or as an ATR multiple.
- What it does not mean
- Not a reversal signal; one wick and one close.
- Check yourself
- Did the next bar close the same way?
Compress (grey dashed box)
price chart
Not a trend reading
- What it measures
- Drawn while the ATR rank is in its lowest 10% over the look-back (on until above 15%), stretching to each bar's high and low. The last two boxes are kept.
- Technical setup
- Volatility contraction. Technicians often mark the box edges and wait for a close outside with a clean move.
- What it does not mean
- Not a direction.
- Check yourself
- How many bars has the box lasted?
Breakout [price] (green dashed) and Breakdown [price] (orange-red dashed)
price chart
Not a trend reading
- What it measures
- The top and bottom of the latest compress box while it is live: still compressing, or within the breakout window after (10 bars in Swing style). A close beyond one ends the box; Breakout Up or Breakdown also needs fast momentum that way, ER 0.30 or more and a box of 3 bars or more.
- Technical setup
- Technicians often wait for a close beyond a line rather than a wick, and frame risk on the other side of the box or as an ATR multiple.
- What it does not mean
- Not a prediction of which side gives way.
- Check yourself
- Which line is closer to the close?
Pullback zone (amber box)
price chart
Not a trend reading
- What it measures
- Shown while the state machine holds a trend, set by Up, Down, Breakout Up or Breakdown. ATR, Mid: 0.5 to 1.5 ATR back from the trend extreme, ATR taken at the extreme's bar. Fibonacci method: 38.2–61.8% of the last pivot leg. The box starts at the extreme's bar.
- Technical setup
- A pullback or bounce zone. Technicians often wait for a close back in the trend direction inside it, and frame risk beyond the Floor or Ceiling.
- What it does not mean
- Not support or resistance the tool found; a fixed distance from the extreme.
- Check yourself
- Is the trend extreme still updating?
Pullback Floor [price] or Pullback Ceiling [price] (amber line)
price chart
Not a trend reading
- What it measures
- 2.0 ATR back from the trend extreme with Mid (78.6% with Fibonacci). A close beyond it, a close beyond the last opposite pivot, or a Volatile state clears the trend memory, and the zone and line disappear.
- Technical setup
- Technicians often frame risk beyond this line or the Protected level.
- What it does not mean
- Not the Protected level; the two come from different engines.
- Check yourself
- Is it above or below the Protected level?
Confluence (deeper amber box)
price chart
Not a trend reading
- What it measures
- Off by default. Where the ATR and Fibonacci pullback zones overlap, when they do and the Fibonacci leg exists.
- What it does not mean
- Not a stronger zone by any test; it shows overlap only.
- Check yourself
- How wide is the overlap compared with ATR?
Swing High [price], Swing Low [price] and Mid [price]
price chart, WAIT and Sideways states
Not a trend reading
- What it measures
- Highest high and lowest low of the swing look-back (20 bars in Swing style, current bar excluded), grey dashed; Mid is halfway, grey dotted. Shown only in WAIT, Sideways Up and Sideways Down.
- Technical setup
- Range framing. Technicians often read a range by its edges and wait for a close outside before reading a trend.
- What it does not mean
- Not swings from the zigzag; plain look-back highs and lows.
- Check yourself
- Is price nearer the top or the bottom of this span?
Ext 1.272, Ext 1.618, Ext 2, Ext 2.618 (teal dotted lines)
price chart
Not a trend reading
- What it measures
- Off by default. Three-point extension from the last pivots: up needs a low, a high, then a higher low; each level is that higher low plus (high − first low) × ratio. Down mirrors it. Auto follows the state's side and draws nothing in WAIT or Compressed.
- What it does not mean
- Reference geometry only: fixed conventions, untested as signals, and not places price is expected to reach.
- Check yourself
- Which three pivots is it drawn from?
Demand · vol [low / mid / high] [volume] (blue box)
price chart, below price
Not a trend reading
- What it measures
- The last down candle before an upward BOS or CHoCH move, from its high to its low. The label shows the volume traded inside the block while the move formed, ranked low, mid or high against the last 30 blocks. Removed on a close below it. Low-volume blocks are hidden by default.
- Technical setup
- Order-block framing. Technicians often note where a move that broke structure started, and how price behaves when it returns there.
- What it does not mean
- Not a turning point; it marks where the move started.
- Check yourself
- Is the block's volume low, mid or high?
Supply · vol [low / mid / high] [volume] (red box)
price chart, above price
Not a trend reading
- What it measures
- The last up candle before a downward BOS or CHoCH move, from its high to its low, with the volume traded inside it ranked against the last 30 blocks. Removed on a close above it.
- Technical setup
- Order-block framing. Technicians often note where a move that broke structure started, and how price behaves when it returns there.
- What it does not mean
- Not a turning point; it marks where the move started.
- Check yourself
- Has price come back to the block since it was drawn?
Leg volume profile (grey rows right of price)
price chart, right of the last bar
Not a trend reading
- What it measures
- Volume at price from the Protected level to the last bar, in 24 rows. Each bar's volume is spread over its high–low range, so it is an estimate from chart bars, not tick data. Rebuilt on the latest bar, forming bar included.
- Technical setup
- Volume-at-price framing. Technicians often look at where a leg traded most and where it traded least.
- What it does not mean
- Not support or resistance; it shows where the leg traded.
- Check yourself
- Is the last close inside or outside the value area?
POC [price] · [share]% · [volume] (orange line)
price chart, right of the last bar
Not a trend reading
- What it measures
- The profile row with the most volume, with its share of the leg's volume and the leg's total volume. Dotted lines mark the 70% value area around it.
- What it does not mean
- Not a magnet and not a level price must return to.
- Check yourself
- How far is the last close from the POC, in ATR?
POC [price] · vol ×[n] (Smart POC, orange line)
price chart, from the end of a finished leg
Not a trend reading
- What it measures
- The POC of a finished swing leg whose volume was at least the average of the last 20 legs; vol ×[n] is that leg's volume against the average. Removed on a close through it. The last 6 are kept.
- Technical setup
- Reference-level framing. Technicians often note prices where a high-volume leg traded most, and how price behaves on its first return.
- What it does not mean
- Not a turning point or a target; a reference level only.
- Check yourself
- Has price returned to this level since the leg ended?
Green, orange-red or grey candles (Color candles by = Structure)
price chart, candles
Uptrend or downtrend by structure
- What it measures
- Off by default. Green from a break that makes the structure Bullish until a CHoCH down, orange-red the other way, grey before the first break. Set on closed bars; the forming candle keeps the last closed colour.
- What it does not mean
- Not entry timing; a colour for the structure only.
- Check yourself
- When did the colour last change, and at which CHoCH?
TREND, READY and WAIT colours (Color candles by = State)
price chart, candles
Follows the state group
- What it measures
- Off by default. Green or orange-red in TREND by side, blue in READY, orange in WAIT; chart colours while warming up. Set on closed bars.
- What it does not mean
- Not entry timing; a colour for the state group only.
- Check yourself
- Does the candle colour match the dashboard header?
Group → TREND, Group → READY, Group → WAIT
alert
Group changed, any side
- What it measures
- Three conditions. Each fires on the closed bar where the group changes to the one named, but not on the first state after warm-up. Message: Auto Structure: TREND (or READY, WAIT) on [ticker] [interval]. The side is not given.
- What it does not mean
- Not a signal; it reports a change of group.
- Check yourself
- Which state is shown in the dashboard now?
Breakout Up
alert
Uptrend, leaving a compress box
- What it measures
- Fires on the closed bar where the state becomes Breakout Up. Message: Auto Structure: Breakout Up on [ticker] [interval].
- Technical setup
- Volatility expansion after compression. Technicians often wait for a retest of the Breakout line before reading the move as established.
- What it does not mean
- Not an instruction; it reports a state change.
- Check yourself
- Where did the bar close relative to the box?
Breakdown
alert
Downtrend, leaving a compress box
- What it measures
- Fires on the closed bar where the state becomes Breakdown. Message: Auto Structure: Breakdown on [ticker] [interval].
- Technical setup
- Volatility expansion after compression. Technicians often wait for a retest of the Breakdown line from below before reading the move as established.
- What it does not mean
- Not an instruction; it reports a state change.
- Check yourself
- Where did the bar close relative to the box?
BOS
alert
Uptrend or downtrend by structure, continuing
- What it measures
- Fires on the closed bar of every BOS, either side, even with BOS / CHoCH lines switched off. Message: Auto Structure: BOS on [ticker] [interval]. The side is not given.
- Technical setup
- Trend continuation by structure. Technicians often take the side from the Structure row and wait for a pullback before reading further.
- What it does not mean
- Not directional; the side has to be read from the chart.
- Check yourself
- Which side does the Structure row show now?
CHoCH
alert
Change of structure, either side
- What it measures
- Fires on the closed bar of every CHoCH, even with BOS / CHoCH lines switched off. Message: Auto Structure: CHoCH on [ticker] [interval]. The side is not given.
- Technical setup
- A possible change of trend. Technicians often wait for a BOS in the new direction before reading a new trend.
- What it does not mean
- Not a confirmed new trend; one close beyond the Protected level.
- Check yourself
- Which side does the Structure row show now?
Liquidity sweep
alert
Not a trend reading
- What it measures
- Fires on the closed bar of a ◆ sweep, above or below. Needs Liquidity zones on, since no zones exist without it. Message: Auto Structure: liquidity sweep on [ticker] [interval].
- Technical setup
- Sweep-and-reclaim framing. Technicians often wait for the next bars to confirm the rejection before reading anything.
- What it does not mean
- Not a reversal signal, and the side is not given.
- Check yourself
- Was the sweep above a high or below a low?
Order block touched
alert
Not a trend reading
- What it measures
- Fires on the closed bar where price first reaches a live order block. Message: Auto Structure: price reached an order block on [ticker] [interval].
- What it does not mean
- Not a reaction signal; it reports a touch only.
- Check yourself
- Is it a Demand or a Supply block?
Bottom-out Stable ✓
alert
Not a trend reading
- What it measures
- Fires on the first closed bar above the Stable area of the current down leg (38.2% recovered); fires even when the areas are hidden. Message: Auto Structure: Bottom-out Stable ✓ on [ticker] [interval].
- What it does not mean
- Not a bottom; it reports recovery depth.
- Check yourself
- Where is the Protected High?
Bottom-out Confirm ✓
alert
Not a trend reading
- What it measures
- Fires on the first closed bar above the Confirm area of the current down leg (50% recovered); fires even when the areas are hidden. Message: Auto Structure: Bottom-out Confirm ✓ on [ticker] [interval].
- What it does not mean
- Not a confirmed bottom; the structure turns only at the Protected High.
- Check yourself
- How far is the Protected High, in ATR?
Any alert() function call (JSON messages)
alert
Not a trend reading
- What it measures
- One alert for JSON events, once per bar close: group, breakout_up or breakdown, pullback_start, pullback_floor_crossed, flip_crossed (last opposite pivot of the trend memory), bos or choch with direction, sweep_high or sweep_low, order_block_touch, bottom_out_stable or bottom_out_confirm.
- What it does not mean
- Not a signal feed; each message reports one event on a closed bar.
- Check yourself
- Which event does this message name?
Settings
| Setting | Default | What it changes |
|---|---|---|
| Market | Classic | One-year look-back: Classic 252, Crypto 365, FX & Gold 260 or Custom days |
| Style | Auto — follows chart TF | Speed of states and swings: Scalp ≤ 15m, Swing 30m–4H, Position D+ |
| Swing size (× ATR) | 2 | Reversal in ATR(14) that confirms a swing; larger = fewer swings |
| Fibonacci retracement | On | Leg from the Protected level to the extreme since it, 61.8% in gold |
| Bottom-out areas | On | Recovery depth of a down leg, measured up from its low: Stable 23.6–38.2%, Confirm 38.2–50%; Bearish structure only |
| Order blocks + volume | On | Last opposite candle before a BOS or CHoCH move, with the volume traded in it; low-volume blocks hidden |
| Leg volume profile | On | Volume at price from the Protected level to the last bar, with POC and 70% value area |
| Smart POC levels | On | POC of each finished swing leg with at least the 20-leg average volume |
| Color candles by | Off | Off keeps your chart colours; Structure or State colour the candles |
All 67 settings, with ranges
| Setting | Default | Range | What it changes |
|---|---|---|---|
| ① Start here — Market & Style | |||
| Market | Classic | Classic, Crypto, FX & Gold, Custom | Trading days per year behind the one-year rank window: 252, 365, 260 or your own number |
| Trading days per year (Custom only) | 252 | 50 to 366 | Used only with Market = Custom; multiplied by bars per day counted on the chart, capped at 5,000 bars |
| Style | Auto — follows chart TF | Auto — follows chart TF, Scalp · fast · 1m–15m, Swing · medium · 30m–4H, Position · slow · D and above, Custom | Sets momentum, ER, pivot, swing look-back and hold lengths; Auto picks Scalp up to 15m, Swing below D, Position from D |
| ② Pullback | |||
| Pullback method | ATR | ATR, Fibonacci | Pullback zone and Floor / Ceiling as ATR distances from the trend extreme, or as Fib of the last pivot leg |
| Pullback depth | Mid | Shallow, Mid, Deep, Custom | Zone and Floor: ATR 0.3–1 / 1.5, 0.5–1.5 / 2, 1–2 / 3; Fib 23.6–38.2 / 61.8, 38.2–61.8 / 78.6, 50–78.6 / 100% |
| Highlight ATR/Fib confluence | Off | Shades where the ATR and Fibonacci pullback zones overlap, labelled Confluence | |
| ③ Levels on chart | |||
| Liquidity zones | On | Purple zones beyond the last three unswept pivot highs and lows, with ◆ sweep marks; also needed for sweep alerts | |
| Order blocks + volume | On | The last opposite-colour candle before a BOS or CHoCH move, from its high to its low, with the volume traded inside it; removed on a close through it | |
| Hide low-volume order blocks | On | Hides blocks whose volume is in the lowest third of the last 30 blocks | |
| Order blocks per side | 4 | 1 to 8 | Live blocks kept on each side (Demand / Supply); the oldest is removed first |
| Leg volume profile | On | Volume at price from the Protected level to the last bar, drawn as rows right of price, with POC; each bar's volume is spread over its high–low range | |
| Profile anchor (bars back, 0 = auto) | 0 | 0 to 1999 | 0 starts at the Protected level of the current leg (the latest swing when there is no trend); any other number starts that many bars back |
| Profile rows | 24 | 8 to 50 | Number of price rows in the profile |
| Width | 24 | 10 to 80 | How far the longest row reaches to the right, in bars |
| Profile transparency | 82 | 50 to 95 | Higher = lighter rows; the POC and value-area rows are drawn stronger |
| Smart POC levels | On | POC of each finished swing leg, kept only when the leg's volume is at least the 20-leg average; a close through the level removes it | |
| Smart POC min volume (× 20-leg average) | 1 | 0.5 to 3, step 0.1 | Legs below this multiple of the recent average do not create a level |
| Smart POC levels kept | 6 | 1 to 12 | Levels kept; the oldest is removed first |
| Value area 70% | On | Dotted lines at the top and bottom of the rows that hold 70% of the leg's volume around the POC | |
| Compress box | On | Grey dashed box while the ATR rank is in its lowest 10%; the last two boxes are kept | |
| Breakout / Breakdown lines | On | Lines at the top and bottom of the latest compress box while it is live | |
| Pullback zone + Floor / Ceiling | On | Amber zone and Floor or Ceiling line while the state machine holds a trend | |
| Protected level | On | Dashed Protected Low or Protected High line; a close beyond it is a CHoCH | |
| Swing size (× ATR) | 2 | 0.5 or more, step 0.25 | Reversal in ATR(14) that confirms a swing; drives BOS, CHoCH, the Protected level and the Fib leg |
| BOS / CHoCH | On | Dashed break lines with BOS or CHoCH text; the last 12 are kept; BOS and CHoCH alerts still fire | |
| Swing High / Low | On | Swing High, Swing Low and Mid lines over the swing look-back, in WAIT and Sideways states only | |
| Fibonacci retracement | On | Fib lines on the leg from the Protected level to the latest extreme; 61.8% drawn in gold | |
| Bottom-out areas | On | Recovery-depth marks on the structure leg, measured up from its low: Stable (23.6–38.2%) and Confirm (38.2–50%) boxes, Bearish structure only; not Fibonacci support | |
| Fibonacci extension | Off | Auto, Up, Down, Off | Ext 1.272 / 1.618 / 2 / 2.618 lines from the last three pivots; Auto follows the state and draws none in WAIT or Compressed |
| ④ Dashboard | |||
| Show dashboard | On | Shows or hides the state table | |
| Size | Small | Tiny, Small, Normal, Large | Text size of the dashboard |
| Position | Top Right | Top Right, Bottom Right, Top Left, Bottom Left | Corner of the chart where the dashboard sits |
| Expected range row | Off | Shows the Next 10 bars row: a typical high-to-low width for the next 10 bars, from ATR(14); width only, off by default | |
| Preset row | On | Shows the Market and Style in use, with bars per day counted from the chart | |
| ⑤ Colors | |||
| Color candles by | Off | Structure, State, Off | Off keeps your chart's colours; Structure colours by Bullish / Bearish; State by TREND / READY / WAIT |
| Up / TREND | #009E73 | Bullish structure, upward BOS and CHoCH, Breakout line, TREND states that point up | |
| Down | #D55E00 | Bearish structure, downward BOS and CHoCH, Breakdown line, TREND states that point down | |
| READY | #0072B2 | Dashboard header and State-mode candles in the READY group | |
| WAIT | #E69F00 | Dashboard header and State-mode candles in the WAIT group, and the HTF ⚠ text | |
| Liquidity | #8E44AD | Liquidity zones and ◆ sweep marks | |
| Pullback | #F2A900 | Pullback zone, Floor / Ceiling line and Confluence shading | |
| Bottom-out Stable | #56B4E9 | Bottom-out Stable box | |
| Bottom-out Confirm | #009E73 | Bottom-out Confirm box | |
| Golden ratio | #FFD700 | Fib 61.8% line | |
| Demand block | #7FB3D5 | Demand order blocks (after an upward BOS or CHoCH) | |
| Supply block | #E6A29C | Supply order blocks (after a downward BOS or CHoCH) | |
| Volume profile | #9BB0C1 | Leg volume profile rows and value-area lines | |
| POC | #E67E22 | POC row and line of the leg profile, and Smart POC levels | |
| ⑥ Advanced (Style = Custom) | |||
| Momentum short (bars) | 5 | 2 or more | Custom only: fast momentum look-back, used for pullback entry and breakout direction |
| Momentum long (bars) | 20 | 3 or more | Custom only: slow momentum look-back (mL), ranked over about a year; also used by the HTF row |
| Efficiency Ratio length | 10 | 3 or more | Custom only: bars in the Efficiency Ratio, the measure of how straight the path was |
| Pivot left / right bars | 5 | 2 or more | Custom only: bars each side that confirm a pivot for liquidity zones, the Fib pullback leg and Ext lines |
| Swing look-back (bars) | 20 | 5 or more | Custom only: bars behind Swing High / Low and Mid, not counting the current bar |
| Breakout window (bars) | 10 | 1 or more | Custom only: bars a finished compress box can still be broken |
| Breakout hold (bars) | 3 | 1 or more | Custom only: bars a Breakout Up or Breakdown state is kept |
| Minimum state hold (bars) | 2 | 1 or more | Custom only: bars a state must last before it can change (Breakout and Volatile excepted) |
| ATR length | 14 | 2 or more | Every Style: ATR for momentum, volatility rank, pullback zones and liquidity width; swings and range row keep ATR(14) |
| Efficiency Ratio trend threshold | 0.3 | Any value, step 0.01 | Every Style: ER at or above it counts as a clean path; it switches off 0.05 lower |
| Chop ↔ Neutral hold | 3 | 1 or more | Every Style: bars Chop or Neutral must last before switching to the other |
| Group change hold | 3 | 1 or more | Every Style: bars the WAIT / READY / TREND group must last before it changes; Volatile and Breakout override |
| Feature smoothing (EMA bars) | 3 | 1 or more | Every Style: EMA on ER and slow momentum before states are set; 1 = none |
| Custom ATR zone start (× ATR) | 0.5 | Any value, step 0.1 | Pullback depth = Custom only: zone start, in ATR from the trend extreme |
| end | 1.5 | Any value, step 0.1 | Pullback depth = Custom only: zone end, in ATR from the trend extreme |
| Floor / Ceiling | 2 | Any value, step 0.1 | Pullback depth = Custom only: Floor or Ceiling distance, in ATR from the trend extreme |
| Custom Fib zone start % | 38.2 | Any value | Pullback depth = Custom only: zone start, % of the trend's last pivot leg |
| end % | 61.8 | Any value | Pullback depth = Custom only: zone end, % of the trend's last pivot leg |
| Floor / Ceiling % | 78.6 | Any value | Pullback depth = Custom only: Floor or Ceiling, % of the trend's last pivot leg |
Defaults and ranges as published on TradingView, version 2.0.
Questions worth asking
- What is the Protected level?
- After a BOS up, it is the lowest low since the swing high that was broken: the Protected Low. After a BOS down, it is the highest high since the broken swing low: the Protected High. A close beyond it is a CHoCH, and the structure turns. Wicks beyond it do not count.
- When do the Bottom-out areas get a ✓?
- Only in a Bearish structure, on the structure leg from the Protected High to its low. Stable gets a ✓ when the last close is above 38.2% of the leg, Confirm when it is above 50%. The marks say how much of the leg has been recovered, not that a bottom is in. The last bar may still be forming, so the ✓ can change until it closes. The structure itself turns only at the Protected High.
- Which Market preset fits which chart?
- Classic (252 days) for stocks, ETFs and indices, Crypto (365) for markets open seven days a week, FX & Gold (260) for forex pairs and gold. Custom takes the trading days of any other calendar, about 242 for TFEX. The preset only sets the one-year look-back for the ranks; the dashboard Preset row shows what is in use.
Last tended · Something unclear? Ask in the comments on TradingView (opens in a new tab) · For education only. Not investment advice.