Ichimoku Itto
One glance, one cut: five Ichimoku checks read as one score.
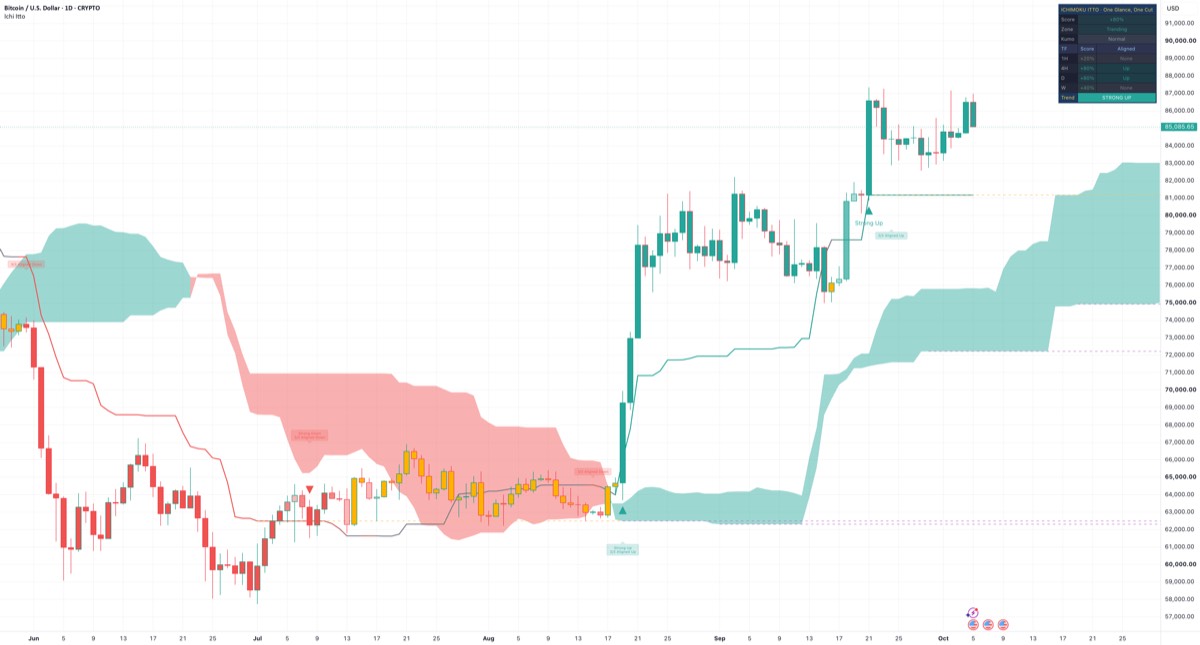
What it draws
- Kijun blade, green to red by score, grey in the chop zone
- Kumo, projected forward
- Candles green or red by score, amber in the chop zone
- Strong Up / Strong Down triangles and 3/3 Aligned labels
- Kijun magnet, dashed orange
- Span B magnet, dashed purple
How it works
Keeps the classic Ichimoku maths, but sums five checks into one score from -100% to +100% instead of leaving five lines to be judged by eye. The checks are price against the Kumo, Tenkan against Kijun, the future Kumo colour, the Kijun slope, and a stricter Chikou test: the close must clear the high or low of the bar Chikou is plotted against. A built-in chop zone covers price inside the Kumo or a score near zero. Flat Kijun and Span B levels are drawn as dashed Equilibrium Magnets, Kumo thickness reads Thin, Normal or Thick, and a table shows four timeframes.
How to use
Read the score and the Trend row as context for your own analysis. The chop zone means no reading: neither Uptrend nor Downtrend. Many technicians read the daily chart as the main view and the weekly chart as context, and the table shows both by default. Marks, labels, magnets and alerts are set on closed bars only. The blade and candle colours on the live bar can change until it closes.
What it does not do
- It does not place orders or know your position. STRONG UP, CHOP ZONE · NO ACTION and the marks are readings, not instructions.
- It does not forecast or give a probability. A score of +80% means four checks read up and one reads neutral. The Kumo is plotted forward by design, not as a forecast.
- It does not suit Heikin Ashi, Renko or other non-standard charts. Its readings assume standard candles or bars.
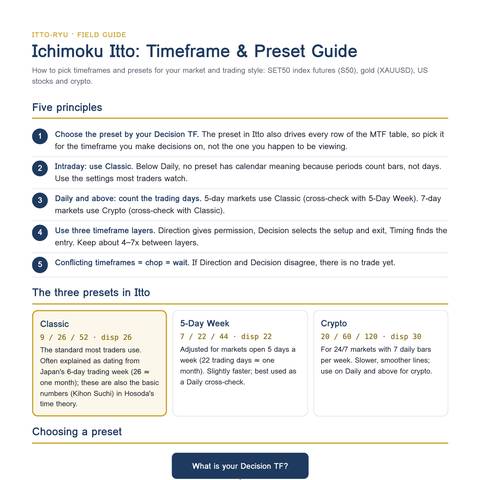
Manual
Timeframe & Preset Guide
Which preset and timeframes to use with Ichimoku Itto for each market and style: index futures, gold, US stocks and crypto, for swing and trend following. Four pages with a preset decision chart, a timeframe map, settings for each style and notes per market.
Five principles
- Choose the preset by your Decision TF. The preset also drives every row of the MTF table.
- Intraday: Classic. Below Daily, periods count bars, not days, so no preset has calendar meaning.
- Daily and above: count the trading days. 5-day markets use Classic, 7-day markets use Crypto.
- Three timeframe layers: Direction, Decision and Timing, about 4–7x apart.
- Timeframes that disagree read as chop: no reading until they line up.
The three presets
- Classic
- 9 / 26 / 52 · disp 26
- 5-Day Week
- 7 / 22 / 44 · disp 22
- Crypto
- 20 / 60 / 120 · disp 30
PDF · 4 pages · 180 KB · For education only. Not investment advice.
Reading the states
Pick a part of the chart, then a word or mark the tool shows there, to see what it measures in technical terms.Each word or mark the tool shows, grouped by the part of the chart where it appears.
Where on the chart
What it shows
STRONG UP
dashboard table, Trend row
Uptrend, strong
- What it measures
- Score +80% or +100% on the chart's current bar, outside the chop zone, so the close is above the Kumo. Solid green cell. The bar may still be forming, so the row can change until it closes.
- Technical setup
- Trend continuation, with nearly every check agreeing. Technicians often wait for a pullback towards the Kijun rather than chasing the move, and frame risk beyond the Kijun or the Kumo, or as an ATR multiple.
- What it does not mean
- Not a forecast; it describes how the five checks stand on this bar.
- Check yourself
- Do the slower rows in the TF table point the same way?
UP
dashboard table, Trend row
Uptrend
- What it measures
- Score +60% on the chart's current bar, with the close outside the Kumo: three points net up out of five. Lighter green cell. The bar may still be forming.
- Technical setup
- Trend continuation with one or two checks not yet agreeing. Technicians often look at which check lags, such as a flat Kijun or a red Kumo ahead, and wait for a pullback to hold above the Kijun, framing risk beyond it or as an ATR multiple.
- What it does not mean
- Not a measure of move size; the score counts checks, not distance.
- Check yourself
- Is the Kijun flat, or is the cloud ahead red?
SIDEWAYS UP
dashboard table, Trend row
Leaning up
- What it measures
- Score +40% on the chart's current bar, with the close outside the Kumo: two points net up. Palest green cell; one point less and the row turns to CHOP ZONE · NO ACTION.
- Technical setup
- An early or fading move: price is clear of the Kumo but the checks only lean up. Technicians often treat it as a transition and wait for +60% or more, or a slower timeframe agreeing, before reading an uptrend.
- What it does not mean
- Not an uptrend reading yet; at least two checks are neutral or point down.
- Check yourself
- Is the score rising out of chop, or falling from UP?
SIDEWAYS DOWN
dashboard table, Trend row
Leaning down
- What it measures
- Score -40% on the chart's current bar, with the close outside the Kumo: two points net down. Palest red cell; one point more and the row turns to CHOP ZONE · NO ACTION.
- Technical setup
- An early or fading move: price is clear of the Kumo but the checks only lean down. Technicians often treat it as a transition and wait for -60% or less, or a slower timeframe agreeing, before reading a downtrend.
- What it does not mean
- Not a downtrend reading yet; at least two checks are neutral or point up.
- Check yourself
- Is the score falling out of chop, or rising from DOWN?
DOWN
dashboard table, Trend row
Downtrend
- What it measures
- Score -60% on the chart's current bar, with the close outside the Kumo: three points net down out of five. Lighter red cell. The bar may still be forming.
- Technical setup
- Trend continuation with one or two checks not yet agreeing. Technicians often look at which check lags, such as a flat Kijun or a green Kumo ahead, and wait for a bounce to stall below the Kijun, framing risk beyond it or as an ATR multiple.
- What it does not mean
- Not a measure of move size; the score counts checks, not distance.
- Check yourself
- Is the Kijun flat, or is the cloud ahead green?
STRONG DOWN
dashboard table, Trend row
Downtrend, strong
- What it measures
- Score -80% or -100% on the chart's current bar, outside the chop zone, so the close is below the Kumo. Solid red cell. The bar may still be forming, so the row can change until it closes.
- Technical setup
- Trend continuation, with nearly every check agreeing. Technicians often wait for a bounce towards the Kijun rather than chasing the move, and frame risk beyond the Kijun or the Kumo, or as an ATR multiple.
- What it does not mean
- Not a forecast; it describes how the five checks stand on this bar.
- Check yourself
- Do the slower rows in the TF table point the same way?
CHOP ZONE · NO ACTION
dashboard table, Trend row
Sideways or chop
- What it measures
- The close is inside the Kumo at the current bar, edges included, or the score is -20%, 0% or +20%. It overrides the score, and also shows while there is no score yet. Amber cell.
- Technical setup
- A range or a transition: price sits in the cloud or the checks cancel out. Technicians often set trend methods aside here and wait for price to leave the Kumo with the score at ±40% or beyond; in a range, risk is usually framed beyond its edges.
- What it does not mean
- Not an instruction; NO ACTION is the tool's name for bars where the score is set aside.
- Check yourself
- Is the close inside the Kumo, or is the score near zero?
+20% to +100%
dashboard table, Score row
Leaning up
- What it measures
- The five-check score on the chart's current bar is +1 to +5 points, 20% each: more checks point up than down. The cell turns greener as it rises. The bar may still be forming.
- Technical setup
- A net count of Ichimoku checks pointing up. Technicians often give it weight only outside the chop zone, from +40% with price clear of the Kumo, and wait for it to hold on a closed bar.
- What it does not mean
- Not a probability; each check simply adds +1, 0 or -1.
- Check yourself
- Does the Zone row say Trending or Chop?
0%
dashboard table, Score row
Mixed
- What it measures
- The five-check score on the chart's current bar is 0: the checks pointing up and down cancel out, or all are neutral. A score of 0 is always in the chop zone, whatever the Chop score band. The bar may still be forming.
- Technical setup
- No net side from the five checks, common in ranges and transitions. Technicians often wait for the score to reach ±40% or beyond with price clear of the Kumo before reading a trend.
- What it does not mean
- Not a flat market; checks pointing up and down can cancel out.
- Check yourself
- Is the close inside the Kumo, or clear of it?
-20% to -100%
dashboard table, Score row
Leaning down
- What it measures
- The five-check score on the chart's current bar is -1 to -5 points, 20% each: more checks point down than up. The cell turns redder as it falls. The bar may still be forming.
- Technical setup
- A net count of Ichimoku checks pointing down. Technicians often give it weight only outside the chop zone, from -40% with price clear of the Kumo, and wait for it to hold on a closed bar.
- What it does not mean
- Not a probability; each check simply adds +1, 0 or -1.
- Check yourself
- Does the Zone row say Trending or Chop?
—
dashboard table, Score row
No reading
- What it measures
- No score yet: the chart does not have enough bars for all five checks (about 77 with Classic). Meanwhile the Trend row shows CHOP ZONE · NO ACTION.
- What it does not mean
- Not a score of zero; there is not yet enough history.
- Check yourself
- How much history does this chart have?
Trending
dashboard table, Zone row
Uptrend or downtrend, out of chop
- What it measures
- The close is outside the Kumo at the current bar and the score is +40% or more, or -40% or less. The cell takes the score's colour, green or red.
- Technical setup
- The state in which trend methods are usually applied. Technicians often take the side from the Trend row and look for a slower timeframe to agree before reading continuation.
- What it does not mean
- Not a direction on its own; the colour and the Trend row give the side.
- Check yourself
- Is the cell green or red, and how strong is the Trend row?
Chop
dashboard table, Zone row
Sideways or chop
- What it measures
- Same test as CHOP ZONE · NO ACTION: the close is inside the Kumo, or the score is -20%, 0% or +20%, or there is no score yet. Amber cell.
- Technical setup
- No clear side from the five checks, as in a range or a turn in progress. Technicians often wait for price to leave the cloud and the score to reach ±40% or beyond before reading a trend; in a range, risk is usually framed beyond its edges.
- What it does not mean
- Not a forecast of a range; the next bar can leave the zone.
- Check yourself
- Did price enter the cloud, or did the checks cancel out?
Thin
dashboard table, Kumo row
Not a trend reading
- What it measures
- The gap between Senkou A and B at the current bar ranks in the bottom 20% of the last 252 bars. Orange text. That part of the cloud was set 25 bars earlier (Classic), so it does not change during the bar.
- What it does not mean
- Not a direction; it measures the cloud's thickness, not its colour.
- Check yourself
- Is the cloud ahead thicker or thinner than the part at the current bar?
Normal
dashboard table, Kumo row
Not a trend reading
- What it measures
- The gap between Senkou A and B at the current bar ranks between the 20th and 80th percentile of the last 252 bars. Blue-grey text.
- What it does not mean
- Not a direction; it measures the cloud's thickness only.
- Check yourself
- Is the cloud ahead getting thicker or thinner?
Thick
dashboard table, Kumo row
Not a trend reading
- What it measures
- The gap between Senkou A and B at the current bar ranks in the top 20% of the last 252 bars. Blue text.
- What it does not mean
- Not a level price must respect; it ranks thickness against this chart's own history.
- Check yourself
- Is price inside, above or below this thick cloud?
—
dashboard table, Kumo row
No reading
- What it measures
- The thickness has no rank yet: the chart does not have enough history for the Kumo and the 252-bar comparison.
- What it does not mean
- Not a thin cloud; there is not yet enough data to rank it.
- Check yourself
- Does the chart reach back far enough to rank the cloud?
1H, 4H, D, W
dashboard table, TF column
Not a trend reading
- What it measures
- The timeframes set in TF 1 to TF 4. Whole hours under a day print as hours (60 as 1H, 240 as 4H); other values print as set, such as 30, D or W. After a timeframe switch the table takes a moment to load.
- What it does not mean
- Not the chart's own timeframe; the Score, Zone, Kumo and Trend rows use that.
- Check yourself
- Which row, if any, matches the chart's timeframe?
+20% to +100%
dashboard table, TF rows, Score column
Leaning up
- What it measures
- That timeframe's score on its latest closed bar is +1 to +5 points, the same on any chart timeframe. The table has no chop test, so this can show at +20% or with the close inside that timeframe's Kumo.
- Technical setup
- Top-down context. Many technicians read D as the main chart and W as the bigger picture, and look for the faster rows to agree with them before reading an uptrend. It is normal for timeframes to disagree.
- What it does not mean
- Not the chart's current bar; on a 1H chart the 1H row can differ from the Score row until the bar closes.
- Check yourself
- Do the D and W rows point the same way?
0%
dashboard table, TF rows, Score column
Mixed
- What it measures
- That timeframe's score on its latest closed bar is 0: the checks pointing up and down cancel out, or all are neutral.
- Technical setup
- No net side on that timeframe, common in ranges and transitions. Technicians often wait for the score there to move clear of zero on a closed bar before reading a trend on it.
- What it does not mean
- Not a flat market; checks pointing up and down can cancel out.
- Check yourself
- Do the other rows show a side?
-20% to -100%
dashboard table, TF rows, Score column
Leaning down
- What it measures
- That timeframe's score on its latest closed bar is -1 to -5 points, the same on any chart timeframe. The table has no chop test, so this can show at -20% or with the close inside that timeframe's Kumo.
- Technical setup
- Top-down context. Many technicians read D as the main chart and W as the bigger picture, and look for the faster rows to agree with them before reading a downtrend. It is normal for timeframes to disagree.
- What it does not mean
- Not the chart's current bar; on a 1H chart the 1H row can differ from the Score row until the bar closes.
- Check yourself
- Do the D and W rows point the same way?
—
dashboard table, TF rows, Score or Aligned column
No reading
- What it measures
- No closed bar of that timeframe could be read. In the Score column it can also mean too few bars there for a score; Aligned then shows None. Below the chart timeframe, a new chart bar shows it until a smaller bar closes.
- What it does not mean
- Not a score of zero, and not a None reading.
- Check yourself
- Did a new chart bar just open, or does that timeframe lack history?
Up
dashboard table, TF rows, Aligned column
Leaning up, three core checks agree
- What it measures
- On that timeframe's latest closed bar, checks 1 to 3 all point up: close above the Kumo, Tenkan above Kijun, and the close above the high of the bar the Chikou is plotted against.
- Technical setup
- The classic three-way agreement, Sanyaku Koten. Technicians often treat it as uptrend context on that timeframe and look for the faster rows to line up with it, framing risk beyond the Kijun or the Kumo.
- What it does not mean
- Not the full score; the Kumo ahead and the Kijun slope can still point down.
- Check yourself
- How strong is the Score column on the same row?
Down
dashboard table, TF rows, Aligned column
Leaning down, three core checks agree
- What it measures
- On that timeframe's latest closed bar, checks 1 to 3 all point down: close below the Kumo, Tenkan below Kijun, and the close below the low of the bar the Chikou is plotted against.
- Technical setup
- The classic three-way agreement, Sanyaku Gyakuten. Technicians often treat it as downtrend context on that timeframe and look for the faster rows to line up with it, framing risk beyond the Kijun or the Kumo.
- What it does not mean
- Not the full score; the Kumo ahead and the Kijun slope can still point up.
- Check yourself
- How strong is the Score column on the same row?
None
dashboard table, TF rows, Aligned column
Mixed
- What it measures
- On that timeframe's latest closed bar, checks 1 to 3 do not all point the same way. Also shown while that timeframe has too few bars for a score. Grey text.
- Technical setup
- No three-way agreement on that timeframe, common in ranges and transitions. Technicians often wait for price, Tenkan and Kijun, and Chikou to line up on a closed bar there before reading a trend.
- What it does not mean
- Not a sideways reading; the same row's score can still reach ±80%.
- Check yourself
- Which of the three checks disagrees?
Green blade (Kijun) and green candles
price chart
Leaning up or stronger
- What it measures
- Outside the chop zone with a score of +40% or more. The Kijun turns a fuller green as the score rises. Candles are green; with Strength shades they are full at +80% and up, lighter at +60%, lightest at +40%.
- Technical setup
- Trend continuation, readable straight from the chart. Technicians often watch whether pullbacks hold above the Kijun, and frame risk beyond it or as an ATR multiple.
- What it does not mean
- Not settled on the live bar; the colours can change until it closes.
- Check yourself
- Has the bar closed with the colour unchanged?
Red blade (Kijun) and red candles
price chart
Leaning down or stronger
- What it measures
- Outside the chop zone with a score of -40% or less. The Kijun turns a fuller red as the score falls. Candles are red; with Strength shades they are full at -80% and below, lighter at -60%, lightest at -40%.
- Technical setup
- Trend continuation, readable straight from the chart. Technicians often watch whether bounces stall below the Kijun, and frame risk beyond it or as an ATR multiple.
- What it does not mean
- Not settled on the live bar; the colours can change until it closes.
- Check yourself
- Has the bar closed with the colour unchanged?
Grey blade (Kijun) and amber candles
price chart
Sideways or chop
- What it measures
- Chop zone: the close is inside the Kumo, or the score is -20%, 0% or +20%, or there is no score yet. Candles are solid amber in both candle styles. On the live bar both can change until it closes.
- Technical setup
- No clear side, as in a range or a turn in progress. Technicians often set the Kijun aside as a trend line here and wait for the chop zone to end before reading a trend; in a range, risk is usually framed beyond its edges.
- What it does not mean
- Not a forecast of a range; it marks bars where the score is set aside.
- Check yourself
- Is price inside the cloud, or is the score near zero?
Green Kumo (cloud)
price chart, cloud
Leaning up
- What it measures
- Senkou A is above Senkou B. Each part of the cloud is drawn 25 bars ahead of the bar it comes from (Classic); its right end is check 4, the future Kumo.
- Technical setup
- The slow layer of Ichimoku. Technicians often read a green cloud ahead as a backdrop for uptrend readings, and watch a twist, where the spans cross, as an early sign of change.
- What it does not mean
- Not a forecast; the cloud is plotted forward by design and does not predict price.
- Check yourself
- What colour is the cloud at its right end?
Red Kumo (cloud)
price chart, cloud
Leaning down
- What it measures
- Senkou A is at or below Senkou B. Each part of the cloud is drawn 25 bars ahead of the bar it comes from (Classic); its right end is check 4, the future Kumo.
- Technical setup
- The slow layer of Ichimoku. Technicians often read a red cloud ahead as a backdrop for downtrend readings, and watch a twist, where the spans cross, as an early sign of change.
- What it does not mean
- Not a forecast; the cloud is plotted forward by design and does not predict price.
- Check yourself
- What colour is the cloud at its right end?
Blue line (Tenkan)
price chart (Lines group, off by default)
Not a trend reading
- What it measures
- Midpoint of the highest high and lowest low of the last 9 bars (Classic). Check 2 compares it with the Kijun: above scores +1, below -1, equal 0. The check runs whether the line is shown or not.
- What it does not mean
- Not a signal on its own; it is one input of the score.
- Check yourself
- Is it above or below the Kijun on the closed bar?
Light grey line shifted back (Chikou)
price chart (Lines group, off by default)
Not a trend reading
- What it measures
- The close, plotted 25 bars back (Classic). Check 3 needs that close above the high (+1) or below the low (-1) of the bar it sits against; anything in between counts 0.
- What it does not mean
- Not the usual close-versus-close test; the tool uses that bar's high and low.
- Check yourself
- Is the line clear of the candles it sits against?
Thin green and red lines at the cloud edges (Senkou spans)
price chart (Lines group, off by default)
Not a trend reading
- What it measures
- Senkou A (green), the midpoint of Tenkan and Kijun, and Senkou B (red), the midpoint of the 52-bar high and low (Classic). Both are plotted 25 bars ahead.
- What it does not mean
- Not levels found by the tool; they are the cloud's two edges.
- Check yourself
- Where do the two lines cross ahead of price?
Strong Up (green triangle below the bar)
price chart, below the bar
Uptrend, strong
- What it measures
- On a closed bar outside the chop zone, the score reaches +80% or more after being below +80% on the bar before. It prints once per crossing, and not when price leaves the Kumo with the score already at +80%.
- Technical setup
- First closed bar of a strong uptrend reading. Technicians often wait for a pullback towards the Kijun rather than chasing, and frame risk beyond the Kijun or the Kumo, or as an ATR multiple.
- What it does not mean
- Not an instruction; it describes the Ichimoku state on a closed bar.
- Check yourself
- Do the slower rows in the TF table read the same way?
Strong Down (red triangle above the bar)
price chart, above the bar
Downtrend, strong
- What it measures
- On a closed bar outside the chop zone, the score reaches -80% or less after being above -80% on the bar before. It prints once per crossing, and not when price leaves the Kumo with the score already at -80%.
- Technical setup
- First closed bar of a strong downtrend reading. Technicians often wait for a bounce towards the Kijun rather than chasing, and frame risk beyond the Kijun or the Kumo, or as an ATR multiple.
- What it does not mean
- Not an instruction; it describes the Ichimoku state on a closed bar.
- Check yourself
- Do the slower rows in the TF table read the same way?
Strong Up / 3/3 Aligned Up (two-line label below the bar)
price chart, below the bar
Uptrend, strong
- What it measures
- A Strong Up crossing and a new 3/3 Aligned Up on the same closed bar, with both marks switched on. The triangle loses its text and both names share one label, 1.5 ATR(14) below the low.
- Technical setup
- A strong uptrend reading with the three core checks newly aligned. Technicians often still wait for a pullback towards the Kijun rather than chasing, framing risk beyond the Kijun or the Kumo.
- What it does not mean
- Not a stronger reading than either mark alone; the texts are merged so they do not overlap.
- Check yourself
- How far above the Kijun did this bar close?
Strong Down / 3/3 Aligned Down (two-line label above the bar)
price chart, above the bar
Downtrend, strong
- What it measures
- A Strong Down crossing and a new 3/3 Aligned Down on the same closed bar, with both marks switched on. The triangle loses its text and both names share one label, 1.5 ATR(14) above the high.
- Technical setup
- A strong downtrend reading with the three core checks newly aligned. Technicians often still wait for a bounce towards the Kijun rather than chasing, framing risk beyond the Kijun or the Kumo.
- What it does not mean
- Not a stronger reading than either mark alone; the texts are merged so they do not overlap.
- Check yourself
- How far below the Kijun did this bar close?
3/3 Aligned Up (label below the bar)
price chart, below the bar
Leaning up, three core checks agree
- What it measures
- First closed bar where checks 1 to 3 all point up: close above the Kumo, Tenkan above Kijun, close above the high of the Chikou's bar. Placed 1.5 ATR(14) below the low; classic Ichimoku calls it Sanyaku Koten.
- Technical setup
- The classic three-way agreement. Technicians often look for the cloud ahead to be green and the Kijun to rise as well before reading a full uptrend, framing risk beyond the Kijun or the Kumo.
- What it does not mean
- Not the full score; the cloud ahead and the Kijun slope can still point down.
- Check yourself
- Is the cloud ahead green, and is the Kijun rising?
3/3 Aligned Down (label above the bar)
price chart, above the bar
Leaning down, three core checks agree
- What it measures
- First closed bar where checks 1 to 3 all point down: close below the Kumo, Tenkan below Kijun, close below the low of the Chikou's bar. Placed 1.5 ATR(14) above the high; classic Ichimoku calls it Sanyaku Gyakuten.
- Technical setup
- The classic three-way agreement. Technicians often look for the cloud ahead to be red and the Kijun to fall as well before reading a full downtrend, framing risk beyond the Kijun or the Kumo.
- What it does not mean
- Not the full score; the cloud ahead and the Kijun slope can still point up.
- Check yourself
- Is the cloud ahead red, and is the Kijun falling?
Dashed orange line (Kijun magnet)
price chart, extended right
Not a trend reading
- What it measures
- The Kijun has held the same level for 8 bars in a row, checked on closed bars. One line per flat run, starting at its first bar; only the last 6 magnets, both kinds together, are kept.
- What it does not mean
- Not a forecast that price returns; in Ichimoku theory it marks a balance price.
- Check yourself
- How far is price from the line now?
Dashed purple line (Span B magnet)
price chart, extended right
Not a trend reading
- What it measures
- Senkou Span B has held the same level for 8 bars in a row, checked on closed bars. The line starts where that flat stretch sits in the cloud, 25 bars ahead with Classic, and extends right.
- What it does not mean
- Not a new level; it extends a flat edge of the cloud.
- Check yourself
- Does it line up with a flat edge of the cloud ahead?
Strong Up
alert
Uptrend, strong
- What it measures
- Same condition as the Strong Up triangle, on confirmed bars only, even with the marks hidden. Message: score crossed up through the Strong threshold.
- Technical setup
- First closed bar of a strong uptrend reading. Technicians often treat such an alert as a prompt to review the chart, then wait for a pullback towards the Kijun rather than chasing.
- What it does not mean
- Not an instruction to act.
- Check yourself
- What do the slower rows in the table show now?
Strong Down
alert
Downtrend, strong
- What it measures
- Same condition as the Strong Down triangle, on confirmed bars only, even with the marks hidden. Message: score crossed down through the Strong threshold.
- Technical setup
- First closed bar of a strong downtrend reading. Technicians often treat such an alert as a prompt to review the chart, then wait for a bounce towards the Kijun rather than chasing.
- What it does not mean
- Not an instruction to act.
- Check yourself
- What do the slower rows in the table show now?
Aligned Up
alert
Leaning up, three core checks agree
- What it measures
- Same condition as the 3/3 Aligned Up label, on confirmed bars only, even with the labels hidden. Message: 3/3 Aligned Up (price, Tenkan/Kijun, Chikou).
- Technical setup
- The classic three-way agreement. Technicians often check the cloud ahead and the Kijun slope as well before reading a full uptrend.
- What it does not mean
- Not the full score; two checks can still point down.
- Check yourself
- What does the Trend row show on this bar?
Aligned Down
alert
Leaning down, three core checks agree
- What it measures
- Same condition as the 3/3 Aligned Down label, on confirmed bars only, even with the labels hidden. Message: 3/3 Aligned Down (price, Tenkan/Kijun, Chikou).
- Technical setup
- The classic three-way agreement. Technicians often check the cloud ahead and the Kijun slope as well before reading a full downtrend.
- What it does not mean
- Not the full score; two checks can still point up.
- Check yourself
- What does the Trend row show on this bar?
Enter Chop
alert
Sideways or chop
- What it measures
- Fires on the closed bar where the chop zone begins after a bar outside it: the close moved into the Kumo, or the score came to -20%, 0% or +20%.
- Technical setup
- A trend reading has paused or ended. Technicians often set trend methods aside here and wait for the chop zone to end, reading a range by its edges.
- What it does not mean
- Not a reversal; the next trend reading can be on either side.
- Check yourself
- Did price move into the cloud, or did the score fade?
Exit Chop
alert
Uptrend or downtrend, leaving chop
- What it measures
- Fires on the closed bar where the chop zone ends: the close is outside the Kumo and the score is +40% or more, or -40% or less. The message does not say which side.
- Technical setup
- A possible start of a trend reading after a range or transition. Technicians often take the side from the Trend row and look for a slower timeframe to agree before reading it as a trend.
- What it does not mean
- Not directional; the side has to be read from the chart.
- Check yourself
- Which side does the Trend row show now?
Settings
| Setting | Default | What it changes |
|---|---|---|
| Preset | Classic | Lengths and displacement: Classic 9/26/52/26, 5-Day Week or Crypto |
| Kijun slope lookback | 5 | Bars back the Kijun is compared with for the slope check |
| Strong threshold | 4 | Score for Strong marks and STRONG UP / DOWN (4 = 80%) |
| Chop score band | 1 | Scores within ±20% also read as chop (1 = 20%) |
| Flat bars | 8 | Bars in a row the Kijun or Span B must stay flat before a magnet is drawn |
| Color candles by trend | On | Colours candles green or red by score, amber in the chop zone |
All 31 settings, with ranges
| Setting | Default | Range | What it changes |
|---|---|---|---|
| Ichimoku | |||
| Preset | Classic | Classic, 5-Day Week, Crypto | Tenkan, Kijun, Span B and displacement: 9/26/52/26, 7/22/44/22 or 20/60/120/30 |
| Kijun slope lookback | 5 | 1 or more | Check 5 compares the Kijun with its value this many bars back; no change scores 0 |
| Signals | |||
| Strong threshold | 4 | 2 to 5 | Points for STRONG UP / DOWN, the triangles, Strong alerts and full shade (4 = 80%) |
| Chop score band | 1 | 0 to 3 | Score within ± this many points is chop, as is a close inside the Kumo (1 = 20%) |
| Show Strong Up / Down marks | On | Shows or hides the Strong triangles and their text; Strong alerts still fire | |
| Show 3/3 Aligned labels | On | Shows or hides the 3/3 Aligned labels; Aligned alerts still fire | |
| Equilibrium Magnets | |||
| Show magnets | On | Shows or hides the dashed lines where the Kijun or Span B stays flat | |
| Flat bars | 8 | 2 or more | Bars in a row the Kijun or Span B must stay level before a magnet is drawn |
| Keep last | 6 | 1 to 20 | Magnet lines kept, both kinds together; the oldest is deleted first |
| Lines | |||
| Tenkan | Off | Draws the Tenkan line; check 2 uses it either way | |
| Chikou | Off | Draws the Chikou, the close shifted 25 bars back (Classic); check 3 uses it either way | |
| Senkou spans | Off | Draws the two cloud edges: Senkou A in green, Senkou B in red | |
| Kumo | On | Shades the cloud, 25 bars ahead with Classic; the score uses it either way | |
| Table | On | Shows or hides the whole dashboard; marks and alerts are unaffected | |
| Size | Small | Tiny, Small, Normal, Large | Text size of the dashboard: Tiny, Small, Normal or Large |
| Color candles by trend | On | Colours candles green, red or amber (chop zone), by the Trend row's rules | |
| Color candles by trend (style) | 3 colors | 3 colors, Strength shades | Strength shades: full colour at ±80% and beyond, lighter at ±60%, lightest at ±40% |
| Colors | |||
| Score +5 | #26A69A | Up colour: blade gradient, candles, marks, labels, table cells, Senkou A line | |
| Score -5 | #EF5350 | Down colour: blade gradient, candles, marks, labels, table cells, Senkou B line | |
| Chop (blade) | #787B86 | Colours the Kijun in the chop zone, and the None and — cells in the table | |
| Tenkan | #2962FF | Colours the optional Tenkan line | |
| Chikou | #B2B5BE | Colours the optional Chikou line | |
| Kijun magnet | #FFB74D | Colours the dashed Kijun magnet lines | |
| Span B magnet | #BA68C8 | Colours the dashed Span B magnet lines | |
| Kumo up | #26A69A73 | Cloud fill where Senkou A is above Senkou B, semi-transparent | |
| Kumo down | #EF535073 | Cloud fill where Senkou A is at or below Senkou B, semi-transparent | |
| Chop zone | #FFB300 | Colours chop-zone candles, the Zone row's Chop cell and the Trend row's CHOP ZONE cell | |
| MTF table | |||
| TF 1 | 1 hour | Timeframe of table row 1, read on its latest closed bar | |
| TF 2 | 4 hours | Timeframe of table row 2, read on its latest closed bar | |
| TF 3 | 1 day | Timeframe of table row 3, read on its latest closed bar | |
| TF 4 | 1 week | Timeframe of table row 4, read on its latest closed bar | |
Defaults and ranges as published on TradingView, version 1.0.
Questions worth asking
- Why can the Score row differ from the 1H row on a 1H chart?
- The TF rows show the latest closed bar of each timeframe, so they read the same on any chart timeframe. The Score and Trend rows show the chart's current bar, which may still be forming. On a 1H chart the two can differ until the bar closes. Different timeframes can also disagree, and that is normal. The table loads a moment after a timeframe switch.
- Which timeframe was Ichimoku designed for, and what do the presets mean?
- Ichimoku was designed for the daily chart. There, the Classic lengths 9, 26 and 52 match about 1.5 weeks, 1 month and 2 months of a 6-day trading week. The 5-Day Week preset (7/22/44) is for markets that trade five days a week, and Crypto (20/60/120) for markets that trade 24/7. On intraday charts the lengths are plain bar counts. No timeframe is claimed to be more accurate.
- What does CHOP ZONE · NO ACTION mean?
- It is the tool's label for no reading, not an instruction. It shows when price is inside the Kumo, whatever the score, or when the score is from -20% to +20%, the default band. The Zone row then reads Chop, the blade turns grey, candles turn amber and Strong marks do not print. 3/3 Aligned labels can still print, as they use only three of the five checks.
Last tended · Something unclear? Ask in the comments on TradingView (opens in a new tab) · For education only. Not investment advice.