EMA Trend Dashboard
Four trend stages from a five-EMA stack.
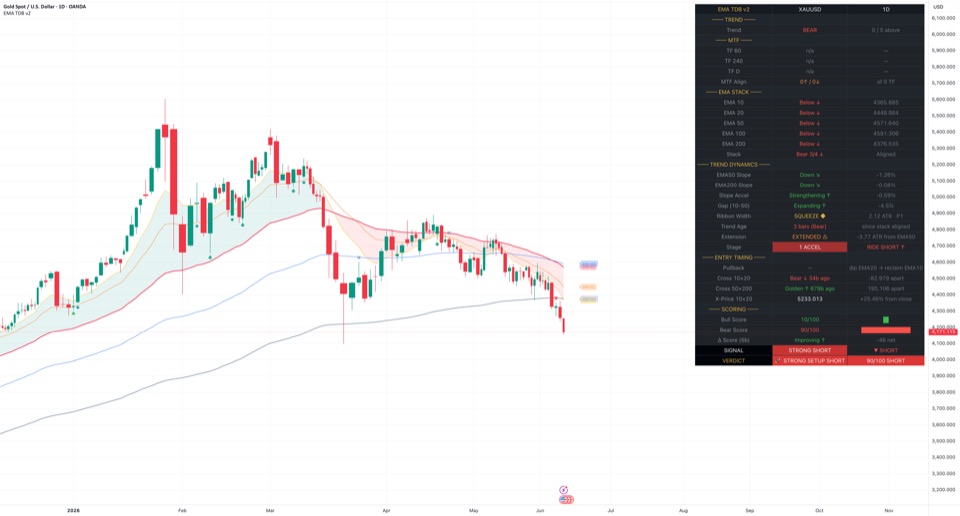
How it works
Five exponential moving averages (10, 20, 50, 100, 200) are read for how well they stack and whether the gap between the 10 and the 50 is widening or narrowing. That places the market in one of four stages: Accel, Mature, Decel, or a broken stack, split by whether the earlier side still leads and how strongly. Up and down scores out of 100, EMA slopes, pullback and cross rows, and up to three higher timeframes add context, and a one-line verdict sums up the reading.
How to use
Use the stage as context for your own analysis, together with the higher-timeframe rows. It describes where a trend is in its life, not what to do about it.
What it does not do
- It does not know your position. HOLD, TRIM and EXIT label the stage, not your trade.
- It does not place orders. SIGNAL, VERDICT and chart markers are readings of the EMAs and scores.
- It does not forecast. Stages and scores describe the EMAs as they stand now.
Reading the states
Pick a part of the chart, then a word or mark the tool shows there, to see what it measures in technical terms.Each word or mark the tool shows, grouped by the part of the chart where it appears.
Where on the chart
What it shows
EMA TDB v2, symbol, timeframe
Dashboard, header row
Not a trend reading
- What it measures
- The script's abbreviated name, then the chart symbol and the chart timeframe code, for example 60 for one hour or D for daily. The v2 text is fixed in the code.
- What it does not mean
- It does not show the published version, which is v3.0.
- Check yourself
- Is the dashboard on the symbol and timeframe you meant to read?
BULL
Dashboard, TREND section, Trend row
Uptrend
- What it measures
- Live bar: at least 3 of 4 neighbouring EMA pairs in up order (faster above slower), close above 4 or more of 5 EMAs, and EMA 3 up 0.1% or more over 5 bars.
- Technical setup
- Uptrend continuation: up-ordered stack, rising 50, price above most EMAs. Technicians often wait for a pullback towards the faster EMAs and a close back above them, with a higher timeframe agreeing, and frame risk beyond the pullback swing or as an ATR multiple.
- What it does not mean
- It does not say the move will continue or how far it may go.
- Check yourself
- Do the MTF rows show the same reading on higher timeframes?
BEAR
Dashboard, TREND section, Trend row
Downtrend
- What it measures
- Live bar: at least 3 of 4 neighbouring EMA pairs in down order (faster below slower), close at or below 4 or more of 5 EMAs, and EMA 3 down 0.1% or more over 5 bars.
- Technical setup
- Downtrend continuation: down-ordered stack, falling 50, price below most EMAs. Technicians often wait for a bounce towards the faster EMAs and a close back below them, with a higher timeframe agreeing, and frame risk beyond the bounce swing or as an ATR multiple.
- What it does not mean
- It does not say the decline will continue or how far it may go.
- Check yourself
- Do the MTF rows show the same reading on higher timeframes?
NEUTRAL
Dashboard, TREND section, Trend row
Mixed
- What it measures
- Neither the full BULL set nor the full BEAR set of three conditions is met on the live bar.
- Technical setup
- A transition or range reading: stack, price position and slope do not all agree. Technicians often wait for all three to line up on a closed bar before treating the move as a trend.
- What it does not mean
- It does not always mean sideways. A fresh move shows this until stack and slope catch up.
- Check yourself
- Which condition is missing: the stack, the price position or the slope?
N / 5 above (e.g. 4 / 5 above)
Dashboard, TREND section, Trend row, column 3
Not a trend reading, price position
- What it measures
- How many of the five EMAs the live close is above. A close exactly on an EMA, or an EMA with no value yet, counts as not above.
- What it does not mean
- It does not show how far price sits from any EMA.
- Check yourself
- Which EMAs is price on the other side of?
BULL
Dashboard, MTF section, TF rows (TF 60, TF 240, TF D by default)
Uptrend
- What it measures
- The same three BULL conditions as the Trend row, worked out on that higher timeframe. With Use closed HTF bars only on, it reads a closed bar there, the last one during a live session.
- Technical setup
- Higher-timeframe trend filter. Technicians often give more weight to faster-chart pullback setups that run with an uptrend on the slower chart, and wait for that slower bar to close before relying on it.
- What it does not mean
- It does not mean the chart timeframe agrees, or that the bar now forming there agrees.
- Check yourself
- Is the higher-timeframe bar now forming still moving the same way?
BEAR
Dashboard, MTF section, TF rows
Downtrend
- What it measures
- The same three BEAR conditions as the Trend row, worked out on that higher timeframe. With Use closed HTF bars only on, it reads a closed bar there, the last one during a live session.
- Technical setup
- Higher-timeframe trend filter. Technicians often give more weight to faster-chart bounce setups that run with a downtrend on the slower chart, and wait for that slower bar to close before relying on it.
- What it does not mean
- It does not mean the chart timeframe agrees, or that the bar now forming there agrees.
- Check yourself
- Is the higher-timeframe bar now forming still moving the same way?
NEUT
Dashboard, MTF section, TF rows
Mixed
- What it measures
- Neither full set of conditions is met on that higher timeframe. It also shows when that timeframe has no data yet.
- Technical setup
- On that slower chart the reading fits a range, a transition or a trend still forming. Technicians often treat faster-chart trends with more caution until the slower chart settles into one direction on a closed bar.
- What it does not mean
- It does not always mean sideways on that timeframe.
- Check yourself
- Do the S number and net score in column 3 lean one way?
off
Dashboard, MTF section, TF rows
No reading
- What it measures
- The checkbox beside that HTF input is unticked, so the row is skipped and left out of MTF Align.
- What it does not mean
- It says nothing about that timeframe.
- Check yourself
- Did you mean to leave this timeframe out?
n/a
Dashboard, MTF section, TF rows
No reading
- What it measures
- The chosen timeframe is the same as or lower than the chart timeframe, so it is skipped and left out of MTF Align.
- What it does not mean
- It does not mean that timeframe is mixed.
- Check yourself
- Is the chart on a lower timeframe than every MTF row?
S1 to S4 · net +N (e.g. S2 · net +24)
Dashboard, MTF section, TF rows, column 3
Leaning up
- What it measures
- That higher timeframe's stage number (1 to 4, no 4a, 4b or 4c) and its Bull Score minus Bear Score, from the same closed or forming bar as the row. A plus sign means the up side scores higher, but +0 is a tie with no lean.
- Technical setup
- Bigger-picture lean from a slower chart. Technicians often use a positive net as a filter, giving more weight to faster-chart pullback setups in the up direction once the slower bar has closed.
- What it does not mean
- The net figure is a score difference, not a probability or a size.
- Check yourself
- Does this stage number match the chart timeframe's Stage row?
S1 to S4 · net -N (e.g. S3 · net -32)
Dashboard, MTF section, TF rows, column 3
Leaning down
- What it measures
- That higher timeframe's stage number (1 to 4, no 4a, 4b or 4c) and its Bull Score minus Bear Score, from the same closed or forming bar as the row. A minus sign means the down side scores higher.
- Technical setup
- Bigger-picture lean from a slower chart. Technicians often use a negative net as a filter, giving more weight to faster-chart bounce setups in the down direction once the slower bar has closed.
- What it does not mean
- The net figure is a score difference, not a probability or a size.
- Check yourself
- Does this stage number match the chart timeframe's Stage row?
N↑ / M↓ in green (e.g. 2↑ / 1↓, of 3 TF)
Dashboard, MTF section, MTF Align row
Leaning up
- What it measures
- More switched-on, valid TF rows read BULL than BEAR. N and M are those two counts, and column 3 shows how many rows were counted.
- Technical setup
- Multi-timeframe alignment. When most slower charts read up, technicians often treat faster-chart pullbacks as trend continuation, and look for the count to hold after the slower bars close.
- What it does not mean
- NEUT rows are left out of both counts, so 1↑ / 0↓ of 3 is thin.
- Check yourself
- How many rows were counted, and how many read NEUT?
N↑ / M↓ in red (e.g. 0↑ / 2↓, of 3 TF)
Dashboard, MTF section, MTF Align row
Leaning down
- What it measures
- More switched-on, valid TF rows read BEAR than BULL. N and M are those two counts, and column 3 shows how many rows were counted.
- Technical setup
- Multi-timeframe alignment. When most slower charts read down, technicians often treat faster-chart bounces as trend continuation, and look for the count to hold after the slower bars close.
- What it does not mean
- NEUT rows are left out of both counts, so 0↑ / 1↓ of 3 is thin.
- Check yourself
- How many rows were counted, and how many read NEUT?
N↑ / M↓ in orange (e.g. 1↑ / 1↓, of 3 TF)
Dashboard, MTF section, MTF Align row
Mixed
- What it measures
- Equal BULL and BEAR counts among switched-on, valid TF rows. This includes 0↑ / 0↓, when every counted row reads NEUT or no row is counted.
- Technical setup
- Timeframes disagree or read neutral, common in a range or around a turning point. Technicians often wait for the count to tip one way on closed higher-timeframe bars before reading a trend.
- What it does not mean
- It does not mean each higher timeframe is sideways. One row can read BULL and another BEAR.
- Check yourself
- How many rows were counted, and how many read NEUT?
Above ↑
Dashboard, EMA STACK section, one row per EMA
Not a trend reading, price above
- What it measures
- Live close is above that EMA. Column 3 shows the EMA value. The Trend row's 'N / 5 above' counts these rows.
- Technical setup
- Price above an EMA is often read as that average acting as support. In pullback setups technicians watch whether closes hold above the faster EMAs, and frame risk beyond the nearest swing rather than the line itself.
- What it does not mean
- It does not mean price will stay above that EMA.
- Check yourself
- Has the chart bar closed above it, or only traded above it?
Below ↓
Dashboard, EMA STACK section, one row per EMA
Not a trend reading, price below
- What it measures
- Live close is at or below that EMA. A close exactly on the EMA counts as below.
- Technical setup
- Price below an EMA is often read as that average acting as resistance. In bounce setups technicians watch whether closes stay below the faster EMAs, and frame risk beyond the nearest swing rather than the line itself.
- What it does not mean
- It does not mean price will stay below that EMA.
- Check yourself
- Has the chart bar closed below it, or only traded below it?
Bull 3/4 ↑ or Bull 4/4 ↑ (column 3: Aligned)
Dashboard, EMA STACK section, Stack row
Leaning up, stack aligned
- What it measures
- At least 3 of the 4 neighbouring pairs (EMA 1 over 2, 2 over 3, 3 over 4, 4 over 5) are in up order on the live bar.
- Technical setup
- An ordered stack, fastest on top, is the classic structure of an uptrend. Technicians often wait for price and the slope of the 50 to agree before calling it a trend, and use the stack as the backdrop for pullback setups.
- What it does not mean
- It ignores price and slope. Price can already sit below several EMAs.
- Check yourself
- Do the Above and Below rows agree with this order?
Bear 3/4 ↓ or Bear 4/4 ↓ (column 3: Aligned)
Dashboard, EMA STACK section, Stack row
Leaning down, stack aligned
- What it measures
- At least 3 of the 4 neighbouring pairs are in down order (each faster EMA below the next slower one) on the live bar.
- Technical setup
- An ordered stack, fastest at the bottom, is the classic structure of a downtrend. Technicians often wait for price and the slope of the 50 to agree before calling it a trend, and use the stack as the backdrop for bounce setups.
- What it does not mean
- It ignores price and slope. Price can already sit above several EMAs.
- Check yourself
- Do the Above and Below rows agree with this order?
Mixed (2↑/2↓) (column 3: Mixed)
Dashboard, EMA STACK section, Stack row
Mixed, stack unaligned
- What it measures
- Fewer than 3 pairs in either order. With all five EMAs available this is almost always a 2 and 2 split. The Stage row is then in stage 4.
- Technical setup
- A tangled stack usually marks a range or a regime change between trends. Technicians often set trend-following setups aside here and wait for at least three pairs to line up again on closed bars.
- What it does not mean
- It does not mean price is range-bound.
- Check yourself
- Which pairs have swapped order, the fast ones or the slow ones?
Up ↗
Dashboard, TREND DYNAMICS section, EMA50 Slope row
Leaning up, EMA50 rising
- What it measures
- EMA 3 is 0.1% or more higher than 5 bars ago, live bar. Green if Bull Score leads or ties, red if Bear Score leads. Column 3 shows the %.
- Technical setup
- A rising trend EMA is a usual condition for trend-continuation setups. Technicians often look for the 200 to rise as well, and treat a flattening 50 as an early sign that momentum is fading.
- What it does not mean
- The colour shows agreement with the leading score, not direction.
- Check yourself
- Is the EMA200 Slope row pointing the same way?
Down ↘
Dashboard, TREND DYNAMICS section, EMA50 Slope row
Leaning down, EMA50 falling
- What it measures
- EMA 3 is 0.1% or more lower than 5 bars ago, live bar. Green if Bear Score leads, red if Bull Score leads or ties.
- Technical setup
- A falling trend EMA is a usual condition for continuation setups in a decline. Technicians often look for the 200 to fall as well, and treat a flattening 50 as an early sign that momentum is fading.
- What it does not mean
- Green here does not mean up. It means it agrees with the leading score.
- Check yourself
- Is the EMA200 Slope row pointing the same way?
Flat →
Dashboard, TREND DYNAMICS section, EMA50 Slope row
Sideways or chop, EMA50 flat
- What it measures
- EMA 3 changed by less than 0.1% either way over 5 bars, live bar. Shown in orange.
- Technical setup
- A flat trend EMA often goes with a range, with price swinging across it. Technicians often treat crossings here as noise and wait for the slope to turn and hold before reading a trend.
- What it does not mean
- It does not mean price is flat. Price can swing around a flat EMA.
- Check yourself
- Is price crossing EMA 3 back and forth, or holding one side?
Up ↗
Dashboard, TREND DYNAMICS section, EMA200 Slope row
Leaning up, EMA200 rising
- What it measures
- EMA 5 is 0.05% or more higher than 5 bars ago, live bar. Colour follows the same agreement rule as the EMA50 Slope row.
- Technical setup
- A rising 200 is widely used as a slow trend filter. Technicians often favour setups in its direction and wait for the faster 50 to agree before reading the move as a full trend.
- What it does not mean
- It does not confirm that the faster EMAs are rising too.
- Check yourself
- Does the EMA50 Slope row agree?
Down ↘
Dashboard, TREND DYNAMICS section, EMA200 Slope row
Leaning down, EMA200 falling
- What it measures
- EMA 5 is 0.05% or more lower than 5 bars ago, live bar. Colour follows the same agreement rule as the EMA50 Slope row.
- Technical setup
- A falling 200 is widely used as a slow trend filter. Technicians often favour setups in its direction and wait for the faster 50 to agree before reading the move as a full trend.
- What it does not mean
- It does not confirm that the faster EMAs are falling too.
- Check yourself
- Does the EMA50 Slope row agree?
Flat →
Dashboard, TREND DYNAMICS section, EMA200 Slope row
Sideways or chop, EMA200 flat
- What it measures
- EMA 5 changed by less than 0.05% either way over 5 bars, live bar.
- Technical setup
- A flat 200 often marks a broad range or a slow transition between trends. Technicians often give its direction less weight here and rely on the faster EMAs and higher timeframes instead.
- What it does not mean
- It does not mean the faster EMAs are flat.
- Check yourself
- What do the faster EMAs show on the EMA50 Slope row?
Strengthening ↑
Dashboard, TREND DYNAMICS section, Slope Accel row
Not a trend reading, slope steepening
- What it measures
- EMA 3 slope is positive and rose more than 0.05 since 5 bars ago, or negative and fell more than 0.05. Uses the raw slope, even when the slope row reads Flat.
- Technical setup
- Momentum building in the current direction, typical of an accelerating trend. Technicians often check whether price is getting stretched from the 50, and frame risk in ATR multiples because steep moves swing wider.
- What it does not mean
- ↑ and green mean steeper, not up. A falling slope getting steeper shows this too.
- Check yourself
- Is the EMA50 Slope row up, down or flat right now?
Weakening ↓
Dashboard, TREND DYNAMICS section, Slope Accel row
Not a trend reading, slope easing
- What it measures
- EMA 3 slope is positive and fell more than 0.05 since 5 bars ago, or negative and rose more than 0.05. Live bar.
- Technical setup
- Momentum fading: the trend EMA still moves, but less steeply. Technicians often read this as an early warning of a pause or a range, and wait for the stack or a close through the 50 to confirm any change.
- What it does not mean
- ↓ and red mean less steep, not down. An easing decline shows this too.
- Check yourself
- Is the EMA50 Slope row up, down or flat right now?
Steady →
Dashboard, TREND DYNAMICS section, Slope Accel row
Not a trend reading, slope steady
- What it measures
- The change in EMA 3 slope over 5 bars is within 0.05 either way, or the slope is exactly zero. Column 3 shows that change.
- Technical setup
- Momentum holding a constant pace. In continuation setups technicians often treat a steady slope as neutral and look to the stack, price position and pullback behaviour for confirmation.
- What it does not mean
- It does not say whether the slope is up, down or flat.
- Check yourself
- What does the EMA50 Slope row read?
Expanding ↑
Dashboard, TREND DYNAMICS section, Gap (10-50) row
Not a trend reading, gap widening
- What it measures
- Size of the EMA 1 to EMA 3 gap, as % of EMA 3, grew by more than 0.05 over 5 bars, live bar. Column 3 shows the signed gap.
- Technical setup
- In an aligned stack, a widening gap between the fast and trend EMAs is typical of an impulse phase. Technicians often wait for a pullback rather than chase an expanding gap, and frame risk in ATR multiples.
- What it does not mean
- ↑ and green mean a wider gap on either side. It shows the same in a decline.
- Check yourself
- Is the gap in column 3 positive or negative?
Compressing ↓
Dashboard, TREND DYNAMICS section, Gap (10-50) row
Not a trend reading, gap narrowing
- What it measures
- Size of the EMA 1 to EMA 3 gap, as % of EMA 3, shrank by more than 0.05 over 5 bars, live bar.
- Technical setup
- A narrowing gap can mark momentum fading or a pullback in progress. Technicians often watch whether the fast EMA holds on its side of the 50, reading a hold as continuation and a cross as a possible regime change.
- What it does not mean
- ↓ and red mean a narrower gap, not a fall in price.
- Check yourself
- Is EMA 1 closing in on EMA 3 from above or from below?
Stable →
Dashboard, TREND DYNAMICS section, Gap (10-50) row
Not a trend reading, gap steady
- What it measures
- Size of the EMA 1 to EMA 3 gap changed by 0.05 or less over 5 bars, live bar.
- Technical setup
- In an aligned stack, a stable gap fits a trend moving at a steady pace, often called a mature phase. Technicians often look for pullbacks to the faster EMAs here and frame risk beyond the pullback swing.
- What it does not mean
- It does not say which side of EMA 3 the fast EMA is on.
- Check yourself
- Is the gap in column 3 positive or negative?
SQUEEZE ◆
Dashboard, TREND DYNAMICS section, Ribbon Width row
Not a trend reading, ribbon narrow
- What it measures
- Spread between the highest and lowest of the five EMAs, in ATRs (14), ranks P20 or lower against the previous 100 bars. Column 3 shows the width and rank.
- Technical setup
- A volatility squeeze: the five EMAs bunched relative to ATR, common in a range before a breakout. Technicians often wait for a close outside the range with the stack lining up, and frame risk beyond the far side of the range.
- What it does not mean
- It does not predict a breakout, its timing or its direction.
- Check yourself
- Is the Stack row aligned or Mixed while the ribbon is narrow?
Wide
Dashboard, TREND DYNAMICS section, Ribbon Width row
Not a trend reading, ribbon wide
- What it measures
- The same EMA spread, in ATRs, ranks P80 or higher against the previous 100 bars, live bar.
- Technical setup
- A wide ribbon often goes with a stretched trend or a sharp move away from the slower EMAs. Technicians often expect more pauses and pullbacks from such readings, and frame risk in ATR multiples, which adjust for the larger swings.
- What it does not mean
- It does not mean the move is about to end.
- Check yourself
- Is the Extension row also showing EXTENDED?
Normal
Dashboard, TREND DYNAMICS section, Ribbon Width row
Not a trend reading, ribbon normal
- What it measures
- The EMA spread ranks above P20 and below P80. Also shown, with P0, when there are too few bars to rank.
- What it does not mean
- It does not mean conditions are average in any other sense.
- Check yourself
- Is the P figure in column 3 drifting towards either end?
N bars (Bull)
Dashboard, TREND DYNAMICS section, Trend Age row
Leaning up, stack age
- What it measures
- Consecutive chart bars, including the live one, that the stack has stayed in up order (at least 3 of 4 pairs). A new alignment starts at 1.
- Technical setup
- Trend age gives context for where a move sits in its life. Technicians often treat a young alignment as a possible new trend that still needs confirmation, and an old one as a mature trend where pullbacks and pauses grow more common.
- What it does not mean
- Age alone does not say a move is early or late.
- Check yourself
- How does this age compare with earlier moves on this chart?
N bars (Bear)
Dashboard, TREND DYNAMICS section, Trend Age row
Leaning down, stack age
- What it measures
- Consecutive chart bars, including the live one, that the stack has stayed in down order (at least 3 of 4 pairs). A new alignment starts at 1.
- Technical setup
- Trend age gives context for where a move sits in its life. Technicians often treat a young alignment as a possible new trend that still needs confirmation, and an old one as a mature trend where pullbacks and pauses grow more common.
- What it does not mean
- Age alone does not say a move is early or late.
- Check yourself
- How does this age compare with earlier moves on this chart?
—
Dashboard, TREND DYNAMICS section, Trend Age row
No reading
- What it measures
- The stack is not aligned: fewer than 3 of 4 pairs in either order.
- What it does not mean
- It does not mean the previous move has reversed.
- Check yourself
- What do the Stage and VERDICT rows say about the last aligned stack?
EXTENDED ⚠
Dashboard, TREND DYNAMICS section, Extension row
Not a trend reading, stretched
- What it measures
- Live close is 2 ATR (14) or more away from EMA 3, above or below. Column 3 shows the signed distance in ATRs.
- Technical setup
- Price stretched two ATRs or more from the trend EMA, a common sign of an overextended move. Technicians often wait for a pullback or a pause before reading fresh continuation, and frame risk in ATR multiples.
- What it does not mean
- It does not say price will return to EMA 3, or when.
- Check yourself
- Is the stretch above or below EMA 3, going by column 3?
OK
Dashboard, TREND DYNAMICS section, Extension row
Not a trend reading, not stretched
- What it measures
- Live close is less than 2 ATR (14) away from EMA 3.
- Technical setup
- Price within a normal distance of the trend EMA, where pullback setups usually form. Technicians often frame risk beyond the nearest swing, which tends to sit closer at this distance.
- What it does not mean
- It does not mean conditions are favourable.
- Check yourself
- Is the distance in column 3 growing bar by bar?
1 ACCEL with RIDE LONG ↑
Dashboard, TREND DYNAMICS section, Stage row
Uptrend, accelerating
- What it measures
- Stack aligned (at least 3 of 4 pairs) and the EMA 1 to EMA 3 gap size grew by more than 0.05 over 5 bars, with Bull Score equal to or above Bear Score. The cell is green.
- Technical setup
- Uptrend in its impulse phase: aligned stack with the fast EMA pulling away from the 50. Technicians often avoid chasing and wait for a pullback towards the faster EMAs, framing risk beyond the pullback swing or as an ATR multiple.
- What it does not mean
- It does not say how far or for how many bars the move will run.
- Check yourself
- Is the Extension row already showing EXTENDED?
1 ACCEL with RIDE SHORT ↑
Dashboard, TREND DYNAMICS section, Stage row
Downtrend, accelerating
- What it measures
- Stack aligned (at least 3 of 4 pairs) and the EMA 1 to EMA 3 gap size grew by more than 0.05 over 5 bars, with Bear Score above Bull Score. The cell is red. The ↑ arrow is fixed text and does not show direction.
- Technical setup
- Downtrend in its impulse phase: aligned stack with the fast EMA pulling away from the 50. Technicians often avoid chasing and wait for a bounce towards the faster EMAs, framing risk beyond the bounce swing or as an ATR multiple.
- What it does not mean
- It does not say how far or for how many bars the move will run.
- Check yourself
- Is the Extension row already showing EXTENDED?
2 MATURE with HOLD LONG
Dashboard, TREND DYNAMICS section, Stage row
Uptrend, steady
- What it measures
- Stack aligned and the gap size changed by 0.05 or less over 5 bars, with Bull Score equal to or above Bear Score.
- Technical setup
- An established uptrend moving at a steady pace. Technicians often look for pullbacks to the 10 or 20 that close back above them, with risk framed beyond the pullback low or in R multiples.
- What it does not mean
- Mature does not mean ending. It means the gap has stopped widening.
- Check yourself
- Is the Δ Score row improving or fading?
2 MATURE with HOLD SHORT
Dashboard, TREND DYNAMICS section, Stage row
Downtrend, steady
- What it measures
- Stack aligned and the gap size changed by 0.05 or less over 5 bars, with Bear Score above Bull Score.
- Technical setup
- An established downtrend moving at a steady pace. Technicians often look for bounces to the 10 or 20 that close back below them, with risk framed beyond the bounce high or in R multiples.
- What it does not mean
- Mature does not mean ending. It means the gap has stopped widening.
- Check yourself
- Is the Δ Score row improving or fading?
3 DECEL with TRIM LONG ⚠
Dashboard, TREND DYNAMICS section, Stage row
Uptrend, slowing
- What it measures
- Stack still aligned but the EMA 1 to EMA 3 gap size shrank by more than 0.05 over 5 bars, with Bull Score equal to or above Bear Score.
- Technical setup
- Uptrend with momentum fading as the fast EMA closes in on the 50. Technicians often watch for a hold above the 50 to confirm continuation, or a stack break to confirm a regime change, and frame risk beyond the latest swing low.
- What it does not mean
- It does not mean the trend has turned. The stack is still in order.
- Check yourself
- Is EMA 1 heading back towards EMA 3, or just pausing?
3 DECEL with TRIM SHORT ⚠
Dashboard, TREND DYNAMICS section, Stage row
Downtrend, slowing
- What it measures
- Stack still aligned but the EMA 1 to EMA 3 gap size shrank by more than 0.05 over 5 bars, with Bear Score above Bull Score.
- Technical setup
- Downtrend with momentum fading as the fast EMA closes in on the 50. Technicians often watch for a hold below the 50 to confirm continuation, or a stack break to confirm a regime change, and frame risk beyond the latest swing high.
- What it does not mean
- It does not mean the trend has turned. The stack is still in order.
- Check yourself
- Is EMA 1 heading back towards EMA 3, or just pausing?
4a WATCH with WATCH LONG ⚠ or WATCH SHORT ⚠
Dashboard, TREND DYNAMICS section, Stage row
Stack broken, lean holding
- What it measures
- Stack has lost its alignment. The higher score is on the same side as the last aligned stack and is 60 or more.
- Technical setup
- Stack break with the earlier lean still strong, often a deep pullback or a pause inside the old trend. Technicians often wait for the stack to realign, or for the lean to fade, before reading continuation or reversal.
- What it does not mean
- It does not mean the earlier move has resumed or ended.
- Check yourself
- Which EMA pairs swapped order to break the stack?
4b EXIT with EXIT LONG ✕ or EXIT SHORT ✕
Dashboard, TREND DYNAMICS section, Stage row
Stack broken, lean fading
- What it measures
- Stack has lost its alignment. The higher score is still on the same side as the last aligned stack, but only 40 to 59.
- Technical setup
- Stack break with the earlier lean fading, a common sign of a regime change or a range. Technicians often treat the old trend as over and wait for a fresh alignment before reading any new trend.
- What it does not mean
- It does not mean a move the other way has started.
- Check yourself
- Do the higher-timeframe rows still lean the earlier way?
4c BUILD with BUILD LONG 👀
Dashboard, TREND DYNAMICS section, Stage row
Stack broken, leaning up
- What it measures
- Stack not aligned and Bull Score leads or ties at 40 or more, while the last aligned stack was in down order or none has formed yet on the loaded chart.
- Technical setup
- Possible regime change: the stack has broken and the up side now leads. Technicians often wait for the stack to reorder upwards on closed bars, with a higher timeframe agreeing, before treating it as a new uptrend.
- What it does not mean
- It does not mean a new stack will form.
- Check yourself
- Has the Stack row started to reorder in that direction?
4c BUILD with BUILD SHORT 👀
Dashboard, TREND DYNAMICS section, Stage row
Stack broken, leaning down
- What it measures
- Stack not aligned and Bear Score leads at 40 or more, while the last aligned stack was in up order or none has formed yet on the loaded chart.
- Technical setup
- Possible regime change: the stack has broken and the down side now leads. Technicians often wait for the stack to reorder downwards on closed bars, with a higher timeframe agreeing, before treating it as a new downtrend.
- What it does not mean
- It does not mean a new stack will form.
- Check yourself
- Has the Stack row started to reorder in that direction?
4 IDLE with WAIT
Dashboard, TREND DYNAMICS section, Stage row
No reading
- What it measures
- Stack not aligned and the higher score is below 40. With all five EMAs available the two scores total at least 80, so this needs an EMA with too little history.
- What it does not mean
- It does not mean the market is quiet.
- Check yourself
- Does the chart have enough bars for the slowest EMA?
Green Stage cell
Dashboard, TREND DYNAMICS section, Stage row, column 2
Leaning up
- What it measures
- Bull Score leads or ties, in stages 1 to 3 and 4a to 4c. Paler in 4c. In 4b it is the opposite colour to the VERDICT row background.
- What it does not mean
- It does not show the stack order, only which score leads.
- Check yourself
- Does the VERDICT row show the same colour?
Red Stage cell
Dashboard, TREND DYNAMICS section, Stage row, column 2
Leaning down
- What it measures
- Bear Score leads, in stages 1 to 3 and 4a to 4c. Paler in 4c. In 4b it is the opposite colour to the VERDICT row background.
- What it does not mean
- It does not show the stack order, only which score leads.
- Check yourself
- Does the VERDICT row show the same colour?
Grey Stage cell
Dashboard, TREND DYNAMICS section, Stage row, column 2
No reading
- What it measures
- Shown in 4 IDLE: stack not aligned and the higher score below 40.
- What it does not mean
- It does not mean the market is quiet.
- Check yourself
- Does the VERDICT row show 💤 NO SETUP too?
TRIGGER ↑
Dashboard, ENTRY TIMING section, Pullback row
Uptrend, pullback reclaimed
- What it measures
- Up-ordered stack. Close crossed above EMA 1 within 5 bars of a low reaching EMA 2, or one bar touched EMA 2 and closed above EMA 1, not below its open. First bar only.
- Technical setup
- Trend continuation after a pullback: a dip to the 20 followed by a reclaim of the 10 in an up-ordered stack. Technicians often wait for the bar to close with the reclaim intact and frame risk beyond the pullback low or as an ATR multiple.
- What it does not mean
- It does not mean the pullback is over or that price will rise.
- Check yourself
- Has the chart bar closed with the reclaim still in place?
TRIGGER ↓
Dashboard, ENTRY TIMING section, Pullback row
Downtrend, bounce rejected
- What it measures
- Down-ordered stack. Close crossed below EMA 1 within 5 bars of a high reaching EMA 2, or one bar touched EMA 2 and closed below EMA 1, not above its open. First bar only.
- Technical setup
- Trend continuation after a bounce: a rally to the 20 that turns back under the 10 in a down-ordered stack. Technicians often wait for the bar to close below the 10 and frame risk beyond the bounce high or as an ATR multiple.
- What it does not mean
- It does not mean the bounce is over or that price will fall.
- Check yourself
- Has the chart bar closed with the move back under EMA 1 intact?
In zone (bull)
Dashboard, ENTRY TIMING section, Pullback row
Uptrend, pulling back
- What it measures
- Up-ordered stack and the live bar's low is at or below EMA 2.
- Technical setup
- A pullback into the 20 within an uptrend. Technicians often wait for a close back above the 10 to confirm the dip has ended, and watch whether price holds above the 50.
- What it does not mean
- It does not check how far below EMA 2 price went.
- Check yourself
- Is price still above EMA 3, going by the EMA STACK rows?
In zone (bear)
Dashboard, ENTRY TIMING section, Pullback row
Downtrend, bouncing
- What it measures
- Down-ordered stack and the live bar's high is at or above EMA 2.
- Technical setup
- A bounce into the 20 within a downtrend. Technicians often wait for a close back below the 10 to confirm the bounce has ended, and watch whether price stays below the 50.
- What it does not mean
- It does not check how far above EMA 2 price went.
- Check yourself
- Is price still below EMA 3, going by the EMA STACK rows?
Touched Nb ago (up-ordered stack)
Dashboard, ENTRY TIMING section, Pullback row
Uptrend, recent pullback
- What it measures
- Stack in up order and the last bar whose low reached EMA 2 was 1 to 5 bars ago. It keeps showing after a TRIGGER has already printed.
- Technical setup
- A recent pullback to the 20 in an uptrend. Technicians often look for a close back above the 10 within a few bars; when none comes, the pullback may be turning into something deeper.
- What it does not mean
- It does not mean a reclaim is still pending.
- Check yourself
- Did a diamond already print after this touch?
Touched Nb ago (down-ordered stack)
Dashboard, ENTRY TIMING section, Pullback row
Downtrend, recent bounce
- What it measures
- Stack in down order and the last bar whose high reached EMA 2 was 1 to 5 bars ago. It keeps showing after a TRIGGER has already printed.
- Technical setup
- A recent bounce to the 20 in a downtrend. Technicians often look for a close back below the 10 within a few bars; when none comes, the bounce may be turning into something larger.
- What it does not mean
- It does not mean a move back under EMA 1 is still pending.
- Check yourself
- Did a diamond already print after this touch?
—
Dashboard, ENTRY TIMING section, Pullback row
No reading
- What it measures
- No EMA 2 touch on the aligned side within the last 5 bars, or the stack is not aligned.
- What it does not mean
- It does not mean there is no pullback, only none of this pattern.
- Check yourself
- Is the stack aligned at all right now?
Bull ↑ Nb ago
Dashboard, ENTRY TIMING section, Cross 10×20 row
Leaning up, fast EMAs
- What it measures
- EMA 1 is above EMA 2 now. N is bars since EMA 1 last crossed EMA 2. Column 3 shows EMA 1 minus EMA 2 in price units.
- Technical setup
- A fast EMA cross marks a near-term momentum shift. Technicians often read it against the slower stack, giving weight to crosses that agree with the larger trend and treating crosses against it as pullbacks or bounces.
- What it does not mean
- It does not say the fast EMAs will stay in this order.
- Check yourself
- Is the gap in column 3 widening or narrowing?
Bear ↓ Nb ago
Dashboard, ENTRY TIMING section, Cross 10×20 row
Leaning down, fast EMAs
- What it measures
- EMA 1 is at or below EMA 2 now. N is bars since EMA 1 last crossed EMA 2. Column 3 shows EMA 1 minus EMA 2 in price units.
- Technical setup
- A fast EMA cross marks a near-term momentum shift. Technicians often read it against the slower stack, giving weight to crosses that agree with the larger trend and treating crosses against it as pullbacks or bounces.
- What it does not mean
- It does not say the fast EMAs will stay in this order.
- Check yourself
- Is the gap in column 3 widening or narrowing?
Golden ↑ Nb ago
Dashboard, ENTRY TIMING section, Cross 50×200 row
Leaning up, slow EMAs
- What it measures
- EMA 3 is above EMA 5 now. N is bars since EMA 3 last crossed EMA 5. Column 3 shows EMA 3 minus EMA 5 in price units.
- Technical setup
- The golden cross is a classic slow trend signal that lags turns by design. Technicians often treat it as confirmation of a trend already under way, and look for a rising 200 to back it.
- What it does not mean
- It does not date the start of a move, only the last cross.
- Check yourself
- Does the EMA200 Slope row agree with this order?
Death ↓ Nb ago
Dashboard, ENTRY TIMING section, Cross 50×200 row
Leaning down, slow EMAs
- What it measures
- EMA 3 is at or below EMA 5 now. N is bars since EMA 3 last crossed EMA 5. Column 3 shows EMA 3 minus EMA 5 in price units.
- Technical setup
- The death cross is a classic slow trend signal that lags turns by design. Technicians often treat it as confirmation of a decline already under way, and look for a falling 200 to back it.
- What it does not mean
- It does not date the start of a move, only the last cross.
- Check yourself
- Does the EMA200 Slope row agree with this order?
—
Dashboard, ENTRY TIMING section, Cross 10×20 and Cross 50×200 rows
No reading
- What it measures
- No cross between those two EMAs exists in the loaded chart history.
- What it does not mean
- It does not mean the EMAs are level. Column 3 still shows the gap.
- Check yourself
- Would more chart history show the last cross?
Price value with ±x.xx% from close
Dashboard, ENTRY TIMING section, X-Price 10×20 row
Not a trend reading, cross level
- What it measures
- The next bar's close at which EMA 1 and EMA 2 would meet, from their live values. Column 3 is its distance from the live close. Shows a dash if both lengths match.
- Technical setup
- In crossover work this is the next-bar close at which the fast pair would meet. Technicians sometimes use it to gauge how near a momentum shift is.
- What it does not mean
- It is not a forecast or a level price is expected to reach.
- Check yourself
- Is the current bar still open, so this figure will keep moving?
Bull Score N/100 with █ bar
Dashboard, SCORING section
Not a trend reading, up-side score
- What it measures
- 8 per EMA the live close is above, 10 per pair in up order, 10 if the EMA 3 slope is Up, 10 if the gap is Expanding with an up-ordered stack.
- Technical setup
- Composite trend scores combine stack order, price position, slope and gap expansion. Technicians often read the difference between the two scores rather than one score alone, treating a wide difference as a clear trend and a narrow one as a range.
- What it does not mean
- It is not a probability. With full EMA data the two scores add to 80 to 100.
- Check yourself
- How far apart are the two scores?
Bear Score N/100 with █ bar
Dashboard, SCORING section
Not a trend reading, down-side score
- What it measures
- 8 per EMA the live close is at or below, 10 per pair in down order, 10 if the EMA 3 slope is Down, 10 if the gap is Expanding with a down-ordered stack.
- Technical setup
- Composite trend scores combine stack order, price position, slope and gap expansion. Technicians often read the difference between the two scores rather than one score alone, treating a wide difference as a clear trend and a narrow one as a range.
- What it does not mean
- It is not a probability. With full EMA data the two scores add to 80 to 100.
- Check yourself
- How far apart are the two scores?
Improving ↑
Dashboard, SCORING section, Δ Score (5b) row
Not a trend reading, lead widening
- What it measures
- The leading side's margin (Bull minus Bear, reversed when Bear leads) grew by more than 5 points versus 5 bars ago. Column 3 shows the raw Bull minus Bear change.
- Technical setup
- A widening lead is typical of a trend gaining structure. Technicians often look for it to agree with the stage and slope rows before treating a move as trend continuation.
- What it does not mean
- ↑ means the leading side gained. If Bear leads, the down side gained.
- Check yourself
- Which score is leading right now?
Fading ↓
Dashboard, SCORING section, Δ Score (5b) row
Not a trend reading, lead narrowing
- What it measures
- The leading side's margin shrank by more than 5 points versus 5 bars ago. Column 3 shows the raw Bull minus Bear change.
- Technical setup
- A shrinking lead can be an early sign of momentum fading or a range forming. Technicians often wait for the stack or the stage to confirm a change before reading it as a reversal.
- What it does not mean
- It does not mean the other side now leads.
- Check yourself
- Is the gap between the two scores close to zero?
Flat →
Dashboard, SCORING section, Δ Score (5b) row
Not a trend reading, lead unchanged
- What it measures
- The leading side's margin changed by 5 points or less versus 5 bars ago.
- What it does not mean
- It does not say which side leads or by how much.
- Check yourself
- Which score is leading, and by how much?
STRONG LONG
Dashboard, SIGNAL row, column 2
Uptrend, strong
- What it measures
- Bull Score 80 or more and at least 3 of 4 EMA pairs in up order, live bar.
- Technical setup
- A strong uptrend reading on an up-ordered stack. Technicians often avoid chasing such readings and wait for a pullback towards the faster EMAs, framing risk beyond the pullback low or in R multiples.
- What it does not mean
- It describes EMA order, price position and slope, not what comes next.
- Check yourself
- Does the Trend row also read BULL?
LONG
Dashboard, SIGNAL row, column 2
Leaning up, above EMAs
- What it measures
- Bull Score 60 or more and the live close above at least 4 of 5 EMAs, without meeting the strong case.
- Technical setup
- Price above most EMAs with a clear up-side lean, without the strong case. Technicians often wait for the stack to align or a higher timeframe to agree before reading it as trend continuation.
- What it does not mean
- It is not an instruction, and it can show while the stack is unaligned.
- Check yourself
- Is the Stack row aligned or Mixed?
STRONG SHORT
Dashboard, SIGNAL row, column 2
Downtrend, strong
- What it measures
- Bear Score 80 or more and at least 3 of 4 EMA pairs in down order, live bar.
- Technical setup
- A strong downtrend reading on a down-ordered stack. Technicians often avoid chasing such readings and wait for a bounce towards the faster EMAs, framing risk beyond the bounce high or in R multiples.
- What it does not mean
- It describes EMA order, price position and slope, not what comes next.
- Check yourself
- Does the Trend row also read BEAR?
SHORT
Dashboard, SIGNAL row, column 2
Leaning down, below EMAs
- What it measures
- Bear Score 60 or more and the live close at or below at least 4 of 5 EMAs, without meeting the strong case.
- Technical setup
- Price below most EMAs with a clear down-side lean, without the strong case. Technicians often wait for the stack to align or a higher timeframe to agree before reading it as trend continuation.
- What it does not mean
- It is not an instruction, and it can show while the stack is unaligned.
- Check yourself
- Is the Stack row aligned or Mixed?
WEAK BULL
Dashboard, SIGNAL row, column 2
Leaning up
- What it measures
- Bull Score is higher than Bear Score but neither of the two stronger up cases is met.
- Technical setup
- An early or fading up-side lean, often seen in ranges and transitions. Technicians often wait for more conditions to line up, such as the stack and the slope, before reading it as a trend.
- What it does not mean
- It does not mean an uptrend is forming.
- Check yourself
- Is the Δ Score row improving for the up side?
WEAK BEAR
Dashboard, SIGNAL row, column 2
Leaning down
- What it measures
- Bear Score is higher than Bull Score but neither of the two stronger down cases is met.
- Technical setup
- An early or fading down-side lean, often seen in ranges and transitions. Technicians often wait for more conditions to line up, such as the stack and the slope, before reading it as a trend.
- What it does not mean
- It does not mean a downtrend is forming.
- Check yourself
- Is the Δ Score row improving for the down side?
WAIT
Dashboard, SIGNAL row, column 2
Mixed
- What it measures
- Bull and Bear scores are exactly equal. It can also show when an EMA has too little history and the leading score is under 40.
- Technical setup
- Balanced scores usually point to a range. Technicians often wait for a close that breaks the balance and for the stack to line up before reading direction.
- What it does not mean
- It does not mean the market is quiet or flat.
- Check yourself
- Which score was leading on the previous bars?
▲ LONG
Dashboard, SIGNAL row, column 3
Leaning up
- What it measures
- Bull Score is equal to or higher than Bear Score, live bar. Shown in green.
- What it does not mean
- A tie shows ▲. It is a score comparison only.
- Check yourself
- How close are the two scores?
▼ SHORT
Dashboard, SIGNAL row, column 3
Leaning down
- What it measures
- Bear Score is higher than Bull Score, live bar. Shown in red.
- What it does not mean
- It is a score comparison only, not a reading of the stack.
- Check yourself
- How close are the two scores?
💤 NO SETUP
Dashboard, VERDICT row
No reading
- What it measures
- Same case as 4 IDLE: stack not aligned and the higher score below 40. Needs an EMA with too little history.
- What it does not mean
- It does not mean conditions are calm.
- Check yourself
- Does the chart have enough bars for the slowest EMA?
💥 TREND BROKEN LONG / 💥 TREND BROKEN SHORT
Dashboard, VERDICT row
Stack broken, lean fading
- What it measures
- Same case as 4b: stack has lost its alignment, higher score on the side of the last aligned stack but only 40 to 59. The tag names that earlier side.
- Technical setup
- Stack break with the earlier lean fading, a common sign of a regime change or a range. Technicians often treat the old trend as over and wait for a fresh alignment before reading any new trend.
- What it does not mean
- It does not mean a trend the other way has begun.
- Check yourself
- Do the higher-timeframe rows still lean the earlier way?
⚠ STRUCTURE WEAK LONG / ⚠ STRUCTURE WEAK SHORT
Dashboard, VERDICT row
Stack broken, lean holding
- What it measures
- Same case as 4a: stack has lost its alignment, higher score on the side of the last aligned stack and 60 or more.
- Technical setup
- Stack break with the earlier lean still strong, often a deep pullback or a pause inside the old trend. Technicians often wait for the stack to realign, or for the lean to fade, before reading continuation or reversal.
- What it does not mean
- It does not mean the earlier move has resumed or ended.
- Check yourself
- Which EMA pairs swapped order to break the stack?
✅ EARLY SIGNAL LONG
Dashboard, VERDICT row
Uptrend, emerging
- What it measures
- Stage 4c case where Bull Score leads at 60 or more and the live close is above at least 4 of 5 EMAs.
- Technical setup
- A possible new uptrend before the stack has caught up. Technicians often wait for the EMAs to reorder on closed bars and a higher timeframe to agree, and frame risk beyond the most recent swing low.
- What it does not mean
- It does not mean the stack will realign in this direction.
- Check yourself
- Do the higher-timeframe rows lean the same way?
✅ EARLY SIGNAL SHORT
Dashboard, VERDICT row
Downtrend, emerging
- What it measures
- Stage 4c case where Bear Score leads at 60 or more and the live close is at or below at least 4 of 5 EMAs.
- Technical setup
- A possible new downtrend before the stack has caught up. Technicians often wait for the EMAs to reorder on closed bars and a higher timeframe to agree, and frame risk beyond the most recent swing high.
- What it does not mean
- It does not mean the stack will realign in this direction.
- Check yourself
- Do the higher-timeframe rows lean the same way?
👀 SIGNAL BUILDING LONG
Dashboard, VERDICT row
Leaning up, early
- What it measures
- Stage 4c case with Bull Score leading or tied, where the 60 score and 4 of 5 EMAs condition is not met.
- Technical setup
- An early up-side lean after a stack break, often a range or a turn still forming. Technicians often wait for price to clear most EMAs and for the stack to reorder before treating it as a trend.
- What it does not mean
- It does not mean a trend is forming.
- Check yourself
- Is the Δ Score row improving for the leading side?
👀 SIGNAL BUILDING SHORT
Dashboard, VERDICT row
Leaning down, early
- What it measures
- Stage 4c case with Bear Score leading, where the 60 score and 4 of 5 EMAs condition is not met.
- Technical setup
- An early down-side lean after a stack break, often a range or a turn still forming. Technicians often wait for price to drop below most EMAs and for the stack to reorder before treating it as a trend.
- What it does not mean
- It does not mean a trend is forming.
- Check yourself
- Is the Δ Score row improving for the leading side?
📉 EASE LONG ⚠
Dashboard, VERDICT row
Uptrend, slowing
- What it measures
- Stage 3 with Bull Score leading or tied: stack aligned and the EMA 1 to EMA 3 gap shrinking. It takes priority over the strong and clear readings.
- Technical setup
- Uptrend with momentum fading as the fast EMA closes in on the 50. Technicians often watch for a hold above the 50 to confirm continuation, or a stack break to confirm a regime change, and frame risk beyond the latest swing low.
- What it does not mean
- It does not mean the trend has turned, and it is not advice to reduce anything.
- Check yourself
- Is the stack still fully in order on the Stack row?
📉 EASE SHORT ⚠
Dashboard, VERDICT row
Downtrend, slowing
- What it measures
- Stage 3 with Bear Score leading: stack aligned and the EMA 1 to EMA 3 gap shrinking. It takes priority over the strong and clear readings.
- Technical setup
- Downtrend with momentum fading as the fast EMA closes in on the 50. Technicians often watch for a hold below the 50 to confirm continuation, or a stack break to confirm a regime change, and frame risk beyond the latest swing high.
- What it does not mean
- It does not mean the trend has turned, and it is not advice to reduce anything.
- Check yourself
- Is the stack still fully in order on the Stack row?
🚀 STRONG SETUP LONG
Dashboard, VERDICT row
Uptrend, strong
- What it measures
- Stage 1 or 2, and Bull Score leads at 80 or more with at least 3 of 4 pairs in up order.
- Technical setup
- A strong uptrend reading on an up-ordered stack. Technicians often avoid chasing such readings and wait for a pullback towards the faster EMAs, framing risk beyond the pullback low or in R multiples.
- What it does not mean
- It is not an instruction and says nothing about what comes next.
- Check yourself
- Is the Extension row showing EXTENDED?
🚀 STRONG SETUP SHORT
Dashboard, VERDICT row
Downtrend, strong
- What it measures
- Stage 1 or 2, and Bear Score leads at 80 or more with at least 3 of 4 pairs in down order.
- Technical setup
- A strong downtrend reading on a down-ordered stack. Technicians often avoid chasing such readings and wait for a bounce towards the faster EMAs, framing risk beyond the bounce high or in R multiples.
- What it does not mean
- It is not an instruction and says nothing about what comes next.
- Check yourself
- Is the Extension row showing EXTENDED?
✅ SIGNAL CLEAR LONG
Dashboard, VERDICT row
Uptrend
- What it measures
- Stage 1 or 2, and Bull Score leads at 60 or more with the live close above at least 4 of 5 EMAs, below the strong case.
- Technical setup
- Trend continuation reading in an aligned uptrend. Technicians often wait for a pullback and a close back above the faster EMAs, and frame risk beyond the pullback low or in R multiples.
- What it does not mean
- It is not an instruction and says nothing about what comes next.
- Check yourself
- Do the higher-timeframe rows agree?
✅ SIGNAL CLEAR SHORT
Dashboard, VERDICT row
Downtrend
- What it measures
- Stage 1 or 2, and Bear Score leads at 60 or more with the live close at or below at least 4 of 5 EMAs, below the strong case.
- Technical setup
- Trend continuation reading in an aligned downtrend. Technicians often wait for a bounce and a close back below the faster EMAs, and frame risk beyond the bounce high or in R multiples.
- What it does not mean
- It is not an instruction and says nothing about what comes next.
- Check yourself
- Do the higher-timeframe rows agree?
🔥 TREND ACCEL LONG
Dashboard, VERDICT row
Uptrend, accelerating
- What it measures
- Stage 1 with Bull Score leading or tied, meeting neither the strong nor the clear case, usually because the live close is above fewer than 4 EMAs.
- Technical setup
- An accelerating uptrend with price back below some EMAs, often a pullback inside the impulse. Technicians often wait for a close back above the faster EMAs and frame risk beyond the pullback low or as an ATR multiple.
- What it does not mean
- It does not mean price is moving fast in that direction right now.
- Check yourself
- Which EMAs is price on the other side of?
🔥 TREND ACCEL SHORT
Dashboard, VERDICT row
Downtrend, accelerating
- What it measures
- Stage 1 with Bear Score leading, meeting neither the strong nor the clear case, usually because the live close is at or below fewer than 4 EMAs.
- Technical setup
- An accelerating downtrend with price back above some EMAs, often a bounce inside the impulse. Technicians often wait for a close back below the faster EMAs and frame risk beyond the bounce high or as an ATR multiple.
- What it does not mean
- It does not mean price is moving fast in that direction right now.
- Check yourself
- Which EMAs is price on the other side of?
⏸ TREND MATURE LONG
Dashboard, VERDICT row
Uptrend, steady
- What it measures
- Stage 2 with Bull Score leading or tied, meeting neither the strong nor the clear case.
- Technical setup
- A steady uptrend with price on the other side of some EMAs, typical of a pullback in a mature trend. Technicians often wait for a close back above the 10 and 20 and frame risk beyond the pullback low.
- What it does not mean
- Mature does not mean ending.
- Check yourself
- Which EMAs is price on the other side of?
⏸ TREND MATURE SHORT
Dashboard, VERDICT row
Downtrend, steady
- What it measures
- Stage 2 with Bear Score leading, meeting neither the strong nor the clear case.
- Technical setup
- A steady downtrend with price on the other side of some EMAs, typical of a bounce in a mature trend. Technicians often wait for a close back below the 10 and 20 and frame risk beyond the bounce high.
- What it does not mean
- Mature does not mean ending.
- Check yourself
- Which EMAs is price on the other side of?
N/100 LONG (e.g. 72/100 LONG)
Dashboard, VERDICT row, column 3
Leaning up
- What it measures
- Bull Score, when it leads or ties. Shows a dash instead in the 4 IDLE case.
- What it does not mean
- It is not a position size or a confidence level.
- Check yourself
- How far behind is the other score?
N/100 SHORT (e.g. 68/100 SHORT)
Dashboard, VERDICT row, column 3
Leaning down
- What it measures
- Bear Score, when it leads. Shows a dash instead in the 4 IDLE case.
- What it does not mean
- It is not a position size or a confidence level.
- Check yourself
- How far behind is the other score?
Green VERDICT background
Dashboard, VERDICT row, columns 2 and 3
Leaning up
- What it measures
- Bull Score leads or ties, outside the orange and grey cases, darkest for 🚀 and palest for 👀. The exception is 💥 TREND BROKEN, where green means a down-ordered stack broke.
- What it does not mean
- Green behind 💥 TREND BROKEN means a down-ordered stack broke, not that price is rising.
- Check yourself
- Does the Stage cell show the same colour?
Red VERDICT background
Dashboard, VERDICT row, columns 2 and 3
Leaning down
- What it measures
- Bear Score leads, outside the orange and grey cases, darkest for 🚀 and palest for 👀. The exception is 💥 TREND BROKEN, where red means an up-ordered stack broke.
- What it does not mean
- Red behind 💥 TREND BROKEN means an up-ordered stack broke, not that price is falling.
- Check yourself
- Does the Stage cell show the same colour?
Orange VERDICT background
Dashboard, VERDICT row, columns 2 and 3
Uptrend or downtrend, weakening
- What it measures
- Shown for ⚠ STRUCTURE WEAK (stack broken, earlier lean still 60 or more) and 📉 EASE (stack aligned, gap shrinking).
- What it does not mean
- Orange does not show which side is weakening.
- Check yourself
- Which side does the VERDICT text name?
Grey VERDICT background
Dashboard, VERDICT row, columns 2 and 3
No reading
- What it measures
- Shown with 💤 NO SETUP: stack not aligned and the higher score below 40.
- What it does not mean
- It does not mean conditions are calm.
- Check yourself
- Does the chart have enough bars for the slowest EMA?
Green ▲ triangle below the bar
Price chart (Signal markers)
Uptrend, strong
- What it measures
- First bar where Bull Score reaches 80 or more with at least 3 of 4 pairs in up order. On the forming bar it can appear and vanish before close.
- Technical setup
- First bar of a strong uptrend reading. Technicians often wait for the bar to close with the marker in place, then for a pullback rather than chasing, and frame risk beyond the swing low or in ATR multiples.
- What it does not mean
- It is not an instruction and does not mark a low.
- Check yourself
- Did the triangle remain after the bar closed?
Red ▼ triangle above the bar
Price chart (Signal markers)
Downtrend, strong
- What it measures
- First bar where Bear Score reaches 80 or more with at least 3 of 4 pairs in down order. On the forming bar it can appear and vanish before close.
- Technical setup
- First bar of a strong downtrend reading. Technicians often wait for the bar to close with the marker in place, then for a bounce rather than chasing, and frame risk beyond the swing high or in ATR multiples.
- What it does not mean
- It is not an instruction and does not mark a high.
- Check yourself
- Did the triangle remain after the bar closed?
Grey × above the bar
Price chart (Signal markers)
Stack broken
- What it measures
- First bar where the stack loses alignment (fewer than 3 of 4 pairs in either order) after being aligned on the bar before. Either direction.
- Technical setup
- A stack break, a common sign of a regime change or a deep pullback. Technicians often wait to see which side leads afterwards and whether the stack realigns before reading continuation or reversal.
- What it does not mean
- It does not mean the trend has reversed, only that the order broke.
- Check yourself
- Which way do the Stage and VERDICT rows lean now?
Teal ◆ diamond below the bar
Price chart (Pullback markers)
Uptrend, pullback reclaimed
- What it measures
- Same condition as TRIGGER ↑ in the Pullback row. On the forming bar it can appear and vanish before close.
- Technical setup
- Trend continuation after a pullback: a dip to the 20 followed by a reclaim of the 10 in an up-ordered stack. Technicians often wait for the bar to close with the reclaim intact and frame risk beyond the pullback low or as an ATR multiple.
- What it does not mean
- It does not mark a low or say price will rise.
- Check yourself
- Has the chart bar closed with the diamond still there?
Red ◆ diamond above the bar
Price chart (Pullback markers)
Downtrend, bounce rejected
- What it measures
- Same condition as TRIGGER ↓ in the Pullback row. On the forming bar it can appear and vanish before close.
- Technical setup
- Trend continuation after a bounce: a rally to the 20 that turns back under the 10 in a down-ordered stack. Technicians often wait for the bar to close below the 10 and frame risk beyond the bounce high or as an ATR multiple.
- What it does not mean
- It does not mark a high or say price will fall.
- Check yourself
- Has the chart bar closed with the diamond still there?
GC label below the bar
Price chart (Golden/Death cross markers)
Leaning up, golden cross
- What it measures
- EMA 3 crossed from at or below EMA 5 to above it on this bar. On the forming bar it can still undo before close.
- Technical setup
- The golden cross is a classic slow trend signal that lags turns by design. Technicians often treat it as confirmation of a trend already under way, and look for a rising 200 to back it.
- What it does not mean
- It does not mean a new uptrend has started.
- Check yourself
- Is the EMA200 Slope row still Down or Flat?
DC label above the bar
Price chart (Golden/Death cross markers)
Leaning down, death cross
- What it measures
- EMA 3 crossed from at or above EMA 5 to below it on this bar. On the forming bar it can still undo before close.
- Technical setup
- The death cross is a classic slow trend signal that lags turns by design. Technicians often treat it as confirmation of a decline already under way, and look for a falling 200 to back it.
- What it does not mean
- It does not mean a new downtrend has started.
- Check yourself
- Is the EMA200 Slope row still Up or Flat?
Five EMA lines with EMA 10 to EMA 200 tags at the right edge
Price chart, tags five bars right of the latest bar
Not a trend reading
- What it measures
- Each line is an EMA of close at its set length. Each tag names that EMA's length and sits at its latest value, so it moves with the forming bar.
- What it does not mean
- They do not mark support or resistance levels.
- Check yourself
- Does the line order on the chart match the Stack row?
Teal fill between EMA 1 and EMA 3
Price chart
Leaning up, near-term
- What it measures
- EMA 1 is above EMA 3 on that bar.
- What it does not mean
- It says nothing about the slower EMAs.
- Check yourself
- Do EMA 4 and EMA 5 sit below this band too?
Red fill between EMA 1 and EMA 3
Price chart
Leaning down, near-term
- What it measures
- EMA 1 is at or below EMA 3 on that bar.
- What it does not mean
- It says nothing about the slower EMAs.
- Check yourself
- Do EMA 4 and EMA 5 sit above this band too?
Teal bars, solid or faded
Price chart (Color bars by stage, off by default)
Uptrend
- What it measures
- Stage 1 (solid) or stage 2 (faded) with Bull Score equal to or above Bear Score.
- What it does not mean
- Colour follows the higher score, not the stack order.
- Check yourself
- Does the Stack row agree with the bar colour?
Red bars, solid or faded
Price chart (Color bars by stage, off by default)
Downtrend
- What it measures
- Stage 1 (solid) or stage 2 (faded) with Bear Score above Bull Score.
- What it does not mean
- Colour follows the higher score, not the stack order.
- Check yourself
- Does the Stack row agree with the bar colour?
Orange bars
Price chart (Color bars by stage, off by default)
Uptrend or downtrend, slowing
- What it measures
- Stage 3 on either side: stack aligned and the EMA 1 to EMA 3 gap shrinking.
- What it does not mean
- It does not show which side, and does not mean the trend has turned.
- Check yourself
- Which score is leading on the dashboard?
Grey bars
Price chart (Color bars by stage, off by default)
Stack broken
- What it measures
- Stage 4: the stack is not aligned (all of 4a, 4b, 4c and 4 IDLE).
- What it does not mean
- It does not separate fading, weakening or new-side cases.
- Check yourself
- Which stage 4 case does the Stage row show?
EMA TDB — STRONG Long
Alert
Uptrend, strong
- What it measures
- Same condition as the green triangle. When it fires depends on the alert's frequency setting, so it can fire before the bar closes.
- Technical setup
- First bar of a strong uptrend reading. Technicians often set such alerts to once per bar close, then wait for a pullback rather than chasing, and frame risk beyond the swing low or in ATR multiples.
- What it does not mean
- It is not an instruction to act.
- Check yourself
- Is the alert set to once per bar close?
EMA TDB — STRONG Short
Alert
Downtrend, strong
- What it measures
- Same condition as the red triangle. When it fires depends on the alert's frequency setting, so it can fire before the bar closes.
- Technical setup
- First bar of a strong downtrend reading. Technicians often set such alerts to once per bar close, then wait for a bounce rather than chasing, and frame risk beyond the swing high or in ATR multiples.
- What it does not mean
- It is not an instruction to act.
- Check yourself
- Is the alert set to once per bar close?
EMA TDB — Long
Alert
Leaning up, above EMAs
- What it measures
- Bull Score 60 or more with the close above at least 4 of 5 EMAs, below the strong case, becomes true. Fires again when a strong reading drops back to this one.
- Technical setup
- Price above most EMAs with a clear up-side lean, without the strong case. Technicians often wait for the stack to align or a higher timeframe to agree before reading it as trend continuation.
- What it does not mean
- It does not fire when the reading jumps straight to the strong case.
- Check yourself
- Is the alert set to once per bar close?
EMA TDB — Short
Alert
Leaning down, below EMAs
- What it measures
- Bear Score 60 or more with the close at or below at least 4 of 5 EMAs, below the strong case, becomes true. Fires again when a strong reading drops back to this one.
- Technical setup
- Price below most EMAs with a clear down-side lean, without the strong case. Technicians often wait for the stack to align or a higher timeframe to agree before reading it as trend continuation.
- What it does not mean
- It does not fire when the reading jumps straight to the strong case.
- Check yourself
- Is the alert set to once per bar close?
EMA TDB — Stack Broken
Alert
Stack broken
- What it measures
- Same condition as the grey ×: the stage becomes 4 after stage 1, 2 or 3 on the bar before.
- Technical setup
- A stack break, a common sign of a regime change or a deep pullback. Technicians often wait to see which side leads afterwards and whether the stack realigns before reading continuation or reversal.
- What it does not mean
- It does not confirm a reversal, despite the alert message wording.
- Check yourself
- Which side was the stack aligned on before it broke?
EMA TDB — Stage 1 ACCEL
Alert
Uptrend or downtrend, accelerating
- What it measures
- The stage becomes 1 after any other stage on the bar before. The alert does not say which side.
- Technical setup
- Start of an impulse phase in an aligned trend, on either side. Technicians often check the dashboard for the side, then wait for a pullback or bounce rather than chase, framing risk in ATR multiples.
- What it does not mean
- It does not say whether the move is up or down.
- Check yourself
- Which side does the dashboard show as leading?
EMA TDB — Stage 3 DECEL
Alert
Uptrend or downtrend, slowing
- What it measures
- The stage becomes 3 after any other stage on the bar before. The alert does not say which side.
- Technical setup
- Momentum fading in an aligned trend, on either side. Technicians often watch whether the fast EMA holds on its side of the 50, and read a stack break as confirmation of a regime change.
- What it does not mean
- Despite the message wording, it is not advice to reduce anything.
- Check yourself
- Is the stack still aligned on the Stack row?
EMA TDB — Pullback Long
Alert
Uptrend, pullback reclaimed
- What it measures
- Same condition as the teal diamond and TRIGGER ↑. It can fire before the bar closes, depending on the alert's frequency setting.
- Technical setup
- Trend continuation after a pullback: a dip to the 20 followed by a reclaim of the 10 in an up-ordered stack. Technicians often wait for the bar to close with the reclaim intact and frame risk beyond the pullback low or as an ATR multiple.
- What it does not mean
- It does not mean the pullback is over.
- Check yourself
- Is the alert set to once per bar close?
EMA TDB — Pullback Short
Alert
Downtrend, bounce rejected
- What it measures
- Same condition as the red diamond and TRIGGER ↓. It can fire before the bar closes, depending on the alert's frequency setting.
- Technical setup
- Trend continuation after a bounce: a rally to the 20 that turns back under the 10 in a down-ordered stack. Technicians often wait for the bar to close below the 10 and frame risk beyond the bounce high or as an ATR multiple.
- What it does not mean
- It does not mean the bounce is over.
- Check yourself
- Is the alert set to once per bar close?
EMA TDB — Golden Cross
Alert
Leaning up, golden cross
- What it measures
- Same condition as the GC label: EMA 3 crosses above EMA 5.
- Technical setup
- The golden cross is a classic slow trend signal that lags turns by design. Technicians often treat it as confirmation of a trend already under way, and look for a rising 200 to back it.
- What it does not mean
- It does not mean a new uptrend has started.
- Check yourself
- Is the EMA200 Slope row still Down or Flat?
EMA TDB — Death Cross
Alert
Leaning down, death cross
- What it measures
- Same condition as the DC label: EMA 3 crosses below EMA 5.
- Technical setup
- The death cross is a classic slow trend signal that lags turns by design. Technicians often treat it as confirmation of a decline already under way, and look for a falling 200 to back it.
- What it does not mean
- It does not mean a new downtrend has started.
- Check yourself
- Is the EMA200 Slope row still Up or Flat?
Settings
| Setting | Default | What it changes |
|---|---|---|
| EMA 3 (Trend) | 50 | Trend EMA behind the slope, gap and extension rows |
| Slope/Gap Lookback (bars) | 5 | Bars back for slope, gap change and score delta |
| Gap Momentum Threshold (%) | 0.05 | Gap change that separates Accel, Mature and Decel |
| Use closed HTF bars only | On | Higher timeframe rows use only closed bars |
| Pullback: max bars from EMA2 touch to trigger | 5 | Bars allowed between an EMA 2 touch and a trigger |
| Extension Warning (ATR from Trend EMA) | 2 | ATR distance from the trend EMA that shows EXTENDED |
All 36 settings, with ranges
| Setting | Default | Range | What it changes |
|---|---|---|---|
| EMA Lengths | |||
| EMA 1 (Fast) | 10 | 1 or more | Length of the fastest EMA, used for the gap and reclaim checks |
| EMA 2 | 20 | 1 or more | Length of EMA 2, the pullback touch line and fast cross partner |
| EMA 3 (Trend) | 50 | 1 or more | Length of the trend EMA behind slope, gap, extension and stages |
| EMA 4 | 100 | 1 or more | Length of EMA 4, used in the stack order and scores |
| EMA 5 (Long) | 200 | 1 or more | Length of the slowest EMA, used for its slope row and GC/DC |
| Trend Dynamics | |||
| Slope/Gap Lookback (bars) | 5 | 1 or more | Bars compared for slope, gap, acceleration and score change, all timeframes |
| Slope Flat Threshold (%) | 0.1 | 0.01 or more, step 0.01 | EMA 3 change below this % counts as flat, on every timeframe |
| Long EMA Slope Flat Threshold (%) | 0.05 | 0.01 or more, step 0.01 | EMA 5 change below this % reads Flat on its slope row only |
| Slope Accel Threshold (%) | 0.05 | 0.01 or more, step 0.01 | Slope change needed for Strengthening or Weakening rather than Steady |
| Gap Momentum Threshold (%) | 0.05 | 0.01 or more, step 0.01 | Gap size change needed for Expanding or Compressing, which sets stages |
| Multi-Timeframe | |||
| Use closed HTF bars only | On | On reads the last closed higher-timeframe bar, off reads the forming one | |
| HTF 1 | 1 hour | Timeframe of the first MTF row, its checkbox turns it off | |
| HTF 2 | 4 hours | Timeframe of the second MTF row, its checkbox turns it off | |
| HTF 3 | 1 day | Timeframe of the third MTF row, its checkbox turns it off | |
| Entry Timing | |||
| Pullback: max bars from EMA2 touch to trigger | 5 | 1 or more | Bars after an EMA 2 touch in which a reclaim still counts |
| ATR Length | 14 | 1 or more | ATR period for the Extension and Ribbon Width rows |
| Extension Warning (ATR from Trend EMA) | 2 | 0.1 or more, step 0.1 | Distance from EMA 3, in ATRs, at which EXTENDED shows |
| Structure | |||
| Ribbon Width Percentile Lookback | 100 | 10 or more | Bars the ribbon width is ranked against for SQUEEZE and Wide |
| Visuals | |||
| Show EMA Lines | On | Shows or hides the five EMA lines, and the fill with them | |
| EMA 1 Color | #f7c948 | Colours the EMA 1 line and its right-edge label | |
| EMA 2 Color | #fb923c | Colours the EMA 2 line and its right-edge label | |
| EMA 3 Color (Trend) | #f43f5e | Colours the EMA 3 line and its right-edge label | |
| EMA 4 Color | #3b82f6 | Colours the EMA 4 line and its right-edge label | |
| EMA 5 Color | #94a3b8 | Colours the EMA 5 line and its right-edge label | |
| Fill between Fast and Trend EMA | On | Shows the teal or red shading between EMA 1 and EMA 3 | |
| Show EMA labels at right edge | On | Shows each EMA's length label just right of the latest bar | |
| Signal markers (strong long/short, stack break) | On | Shows the green and red triangles and the grey cross | |
| Pullback markers | On | Shows the teal and red diamonds for pullback reclaims | |
| Golden/Death cross markers (EMA3 × EMA5) | On | Shows GC and DC labels when EMA 3 crosses EMA 5 | |
| Color bars by stage | Off | Colours price bars by stage and leading score, off by default | |
| Dashboard | |||
| Show Dashboard | On | Shows or hides the whole dashboard table | |
| Position | top_right | top_right, top_left, middle_right, middle_left, bottom_right, bottom_left | Where on the chart the dashboard sits |
| Size | normal | tiny, small, normal, large | Text size of the dashboard |
| Show MTF section | On | Shows or hides the three higher-timeframe rows and MTF Align | |
| Show EMA Stack section | On | Shows or hides the five above/below rows and the Stack row | |
| Show Entry Timing section | On | Shows or hides the Pullback, Cross and X-Price rows | |
Defaults and ranges as published on TradingView, version 3.0.
Questions worth asking
- Why does the SIGNAL row say STRONG SHORT?
- SIGNAL reads the bull and bear scores. STRONG SHORT means a bear score of 80 or more, with faster EMAs below slower ones in at least three of four pairs. VERDICT adds the stage: STRONG SETUP SHORT, or EASE SHORT at 3 DECEL.
- What does the ENTRY TIMING section show?
- Pullback shows TRIGGER when price touches the 20 EMA in an aligned stack, then closes back past the 10. Two cross rows count bars since the 10×20 and 50×200 crosses. X-Price is the close at which the 10 and 20 EMAs would meet next bar.
- Why does an MTF row show n/a?
- Each row only reads a timeframe above your chart's. With the defaults of 1 hour, 4 hours and 1 day, a 1 hour chart shows n/a on the TF 60 row, and a daily chart shows n/a for all three. Unticking a row shows “off”.
Last tended · Something unclear? Ask in the comments on TradingView (opens in a new tab) · For education only. Not investment advice.