MACD Trend Phase MTF
Which phase of the trend, across several timeframes.
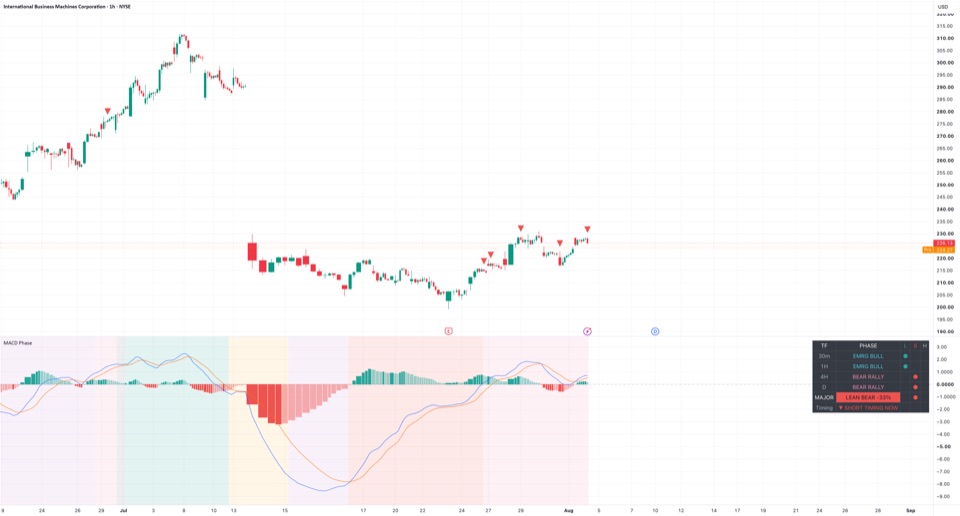
How it works
Reads a PPO-normalised MACD on several timeframes. A slow timeframe sets the regime, a middle one defines the phase that tints the pane, and the chart timeframe tracks timing. A table lists the phase on four grid timeframes and weighs them into one consensus reading, MAJOR. Because it is measured in percentages, the same settings can be used on any instrument.
How to use
Read the phase first, as context for your own analysis. What you do with it is your own decision.
What it does not do
- It does not place orders or know your position. Triangles and table dots are readings, not instructions.
- It does not forecast. A phase describes current MACD momentum, not where price goes next.
- It does not give a probability. The MAJOR percentage is a weighted vote across four timeframes.
Reading the states
Pick a part of the chart, then a word or mark the tool shows there, to see what it measures in technical terms.Each word or mark the tool shows, grouped by the part of the chart where it appears.
Where on the chart
What it shows
TF column (30m, 1H, 4H, D)
MTF table, TF column (grid rows)
Not a trend reading
- What it measures
- The timeframe set in Grid TF 1 to 4. Minute values that divide by 60 print as hours (240 prints 4H), other minute values get an m (30 prints 30m), and values such as D print as entered.
- What it does not mean
- Not the Phase TF setting; the table never says which timeframe drives the background.
- Check yourself
- Is one of these rows the same timeframe as the Phase TF?
EST BULL
MTF table, PHASE column (any grid row)
Uptrend
- What it measures
- On that row's last closed bar: PPO is +0.10% or more and above its signal line, and the last closed Regime TF (daily) PPO is above zero.
- Technical setup
- Trend continuation, with this row and the daily regime on the same side. Technicians often wait for the slower rows to agree and then watch for pullbacks within the trend, framing risk beyond the last swing low or as an ATR multiple.
- What it does not mean
- Not a forecast that the move continues, and not confirmed by the other rows.
- Check yourself
- Do the slower rows read the same way?
EMRG BULL
MTF table, PHASE column (any grid row)
Uptrend, emerging
- What it measures
- On that row's last closed bar: PPO is +0.10% or more and above its signal line, while the last closed Regime TF (daily) PPO is zero or below.
- Technical setup
- A possible early regime change, or a counter-trend move: this row reads up while the daily PPO is still at or below zero. Technicians often wait for the daily to cross zero or a first pullback to hold, framing risk beyond the swing low.
- What it does not mean
- Not agreement with the daily timeframe; the daily PPO is still at or below zero.
- Check yourself
- Is the daily row still reading down?
BULL PB
MTF table, PHASE column (any grid row)
Uptrend, pulling back
- What it measures
- On that row's last closed bar: PPO is +0.10% or more but at or below its signal line, and the latest spell above the signal peaked no lower than the spell before.
- Technical setup
- Trend continuation after a pullback: momentum has dipped below its signal while staying above zero. Technicians often wait for the histogram to turn back up on a closed bar, and frame risk beyond the pullback low or as an ATR multiple.
- What it does not mean
- Not a sign the pullback has ended; PPO is simply still above zero.
- Check yourself
- Has the chart histogram turned up yet, and has that bar closed?
WEAK BULL
MTF table, PHASE column (any grid row)
Uptrend, slowing
- What it measures
- On that row's last closed bar: PPO is +0.10% or more but at or below its signal line, and the latest spell above the signal peaked lower than the spell before.
- Technical setup
- Momentum fading in an uptrend: a lower PPO peak than the one before. Technicians often read this as a warning rather than a plain pullback, wait for a cross above the signal or a drop below zero, and frame risk closer to the recent swing.
- What it does not mean
- Not a downtrend; PPO is still above zero on this row.
- Check yourself
- Do the faster rows already read down or chop?
EST BEAR
MTF table, PHASE column (any grid row)
Downtrend
- What it measures
- On that row's last closed bar: PPO is -0.10% or less and at or below its signal line, and the last closed Regime TF (daily) PPO is zero or below.
- Technical setup
- Trend continuation, with this row and the daily regime on the same side. Technicians often wait for the slower rows to agree and then watch for bounces within the trend, framing risk beyond the last swing high or as an ATR multiple.
- What it does not mean
- Not a forecast that the decline continues, and not confirmed by the other rows.
- Check yourself
- Do the slower rows read the same way?
EMRG BEAR
MTF table, PHASE column (any grid row)
Downtrend, emerging
- What it measures
- On that row's last closed bar: PPO is -0.10% or less and at or below its signal line, while the last closed Regime TF (daily) PPO is above zero.
- Technical setup
- A possible early regime change, or a counter-trend move: this row reads down while the daily PPO is still above zero. Technicians often wait for the daily to cross zero or a first bounce to fail, framing risk beyond the swing high.
- What it does not mean
- Not agreement with the daily timeframe; the daily PPO is still above zero.
- Check yourself
- Is the daily row still reading up?
BEAR RALLY
MTF table, PHASE column (any grid row)
Downtrend, bouncing
- What it measures
- On that row's last closed bar: PPO is -0.10% or less but above its signal line, and the latest spell at or below the signal bottomed no higher than the spell before.
- Technical setup
- Trend continuation after a bounce: momentum has lifted above its signal while staying below zero. Technicians often wait for the histogram to turn back down on a closed bar, and frame risk beyond the bounce high or as an ATR multiple.
- What it does not mean
- Not a turn to an uptrend; PPO is still below zero on this row.
- Check yourself
- Has the chart histogram turned down yet, and has that bar closed?
WEAK BEAR
MTF table, PHASE column (any grid row)
Downtrend, slowing
- What it measures
- On that row's last closed bar: PPO is -0.10% or less but above its signal line, and the latest spell at or below the signal bottomed higher than the spell before.
- Technical setup
- Momentum fading in a downtrend: a higher PPO trough than the one before. Technicians often read this as a warning rather than a plain bounce, wait for a cross below the signal or a rise above zero, and frame risk closer to the recent swing.
- What it does not mean
- Not an uptrend; PPO is still below zero on this row.
- Check yourself
- Do the faster rows already read up or chop?
CHOP
MTF table, PHASE column (any grid row)
Sideways or chop
- What it measures
- On that row's last closed bar the absolute PPO is below 0.10%. Also shown while that row's PPO, its signal line or the daily regime PPO has no data yet.
- Technical setup
- A range or a transition: momentum sits too close to zero for a trend reading. Technicians often wait for the PPO to leave the band with a slower timeframe agreeing, and usually frame risk in a range beyond its edges.
- What it does not mean
- Not proof of a range; it can also mean data is still loading.
- Check yourself
- Is there enough history loaded for this timeframe?
● in the L column
MTF table, L column (grid rows and MAJOR row)
Leaning up
- What it measures
- Grid row: phase is EST BULL, EMRG BULL or BULL PB. MAJOR row: the weighted grid score is +20% or higher.
- Technical setup
- Top-down alignment: on a grid row the dot groups established, emerging and pullback phases on the up side; on MAJOR it marks a weighted lean up. Technicians often look for slower rows to share that side, framing risk beyond a swing those rows should hold.
- What it does not mean
- Not a strength measure; a pullback row gets the same dot as an established one.
- Check yourself
- Is this dot from an established phase or from a pullback?
● in the S column
MTF table, S column (grid rows and MAJOR row)
Leaning down
- What it measures
- Grid row: phase is EST BEAR, EMRG BEAR or BEAR RALLY. MAJOR row: the weighted grid score is -20% or lower.
- Technical setup
- Top-down alignment: on a grid row the dot groups established, emerging and bounce phases on the down side; on MAJOR it marks a weighted lean down. Technicians often look for slower rows to share that side, framing risk beyond a swing those rows should hold.
- What it does not mean
- Not a strength measure; a bounce row gets the same dot as an established one.
- Check yourself
- Is this dot from an established phase or from a bounce?
● in the H column
MTF table, H column (grid rows and MAJOR row)
Mixed
- What it measures
- Grid row: phase is CHOP, WEAK BULL or WEAK BEAR. MAJOR row: the weighted grid score is above -20% and below +20%.
- Technical setup
- No clear side: a grid row in chop or with fading momentum, or a MAJOR score inside the middle band. Technicians often treat this as a range or a transition and wait for a slower row to commit, framing risk beyond the range edges.
- What it does not mean
- Not always a flat market; slowing uptrends and downtrends also land here.
- Check yourself
- Does the PHASE text say CHOP, or a WEAK reading?
BULL n%
MTF table, MAJOR row, teal cell
Uptrend, broad agreement
- What it measures
- Weighted average of the grid row scores is +50% or more. Scores: EST 1, PB or RALLY 0.75, EMRG 0.5, WEAK 0.25, CHOP 0, negative on the down side. Default weights 1, 1.5, 2, 3.
- Technical setup
- Broad multi-timeframe alignment, the usual backdrop for trend continuation. Technicians often still wait for a pullback on a faster timeframe to end, and frame risk beyond that pullback's low or in R multiples.
- What it does not mean
- Not unanimous; one row can read the other way and the score still reach 50%.
- Check yourself
- Which row, if any, reads against the others?
LEAN BULL n%
MTF table, MAJOR row, teal cell
Leaning up
- What it measures
- Weighted average of the four grid row scores is +20% or more but below +50%. Default weights: daily 3, 4H 2, 1H 1.5, 30m 1.
- Technical setup
- Partial alignment: the weighted rows lean up without broad agreement. Technicians often wait for the slower rows, the daily above all, to agree before reading it as trend continuation, and frame risk more cautiously while rows disagree.
- What it does not mean
- Not broad agreement; some rows may read chop, slowing or down.
- Check yourself
- Is the daily row on the same side?
MIXED n%
MTF table, MAJOR row, grey cell
Mixed
- What it measures
- Weighted average of the four grid row scores is above -20% and below +20%, because rows disagree or mostly read CHOP or WEAK.
- Technical setup
- No multi-timeframe alignment, often a range or a transition between trends. Technicians often set trend methods aside here and wait for the weighted reading to leave the middle band; in a range, risk is usually framed beyond its edges.
- What it does not mean
- Not necessarily a quiet market; strong rows on both sides can cancel out.
- Check yourself
- Are the rows split, or mostly CHOP?
LEAN BEAR n%
MTF table, MAJOR row, red cell
Leaning down
- What it measures
- Weighted average of the four grid row scores is -20% or less but above -50%. Default weights: daily 3, 4H 2, 1H 1.5, 30m 1.
- Technical setup
- Partial alignment: the weighted rows lean down without broad agreement. Technicians often wait for the slower rows, the daily above all, to agree before reading it as trend continuation, and frame risk more cautiously while rows disagree.
- What it does not mean
- Not broad agreement; some rows may read chop, slowing or up.
- Check yourself
- Is the daily row on the same side?
BEAR n%
MTF table, MAJOR row, red cell
Downtrend, broad agreement
- What it measures
- Weighted average of the grid row scores is -50% or less. Scores: EST 1, PB or RALLY 0.75, EMRG 0.5, WEAK 0.25, CHOP 0, negative on the down side. Default weights 1, 1.5, 2, 3.
- Technical setup
- Broad multi-timeframe alignment, the usual backdrop for trend continuation. Technicians often still wait for a bounce on a faster timeframe to end, and frame risk beyond that bounce's high or in R multiples.
- What it does not mean
- Not unanimous; one row can read the other way and the score still reach -50%.
- Check yourself
- Which row, if any, reads against the others?
▲ LONG TIMING NOW
MTF table, Timing row
Momentum turned up
- What it measures
- Committed Phase TF (4H) phase is BULL PB, and on the live chart bar the histogram is above the previous bar, which was below the bar before it.
- Technical setup
- The turn that can end a pullback in an uptrend: the chart histogram has started rising again. Technicians usually wait for the chart bar to close with the turn intact, and frame risk beyond the pullback low or as an ATR multiple.
- What it does not mean
- Not a closed-bar reading; it can disappear before the chart bar closes.
- Check yourself
- Has the chart bar closed with the turn still in place?
wait chart hist turn ▲
MTF table, Timing row
Uptrend, pulling back
- What it measures
- Committed Phase TF (4H) phase is BULL PB, but the chart-timeframe histogram has not made a one-bar up-turn on the current bar.
- Technical setup
- A pullback inside an uptrend on the Phase TF, with no histogram turn on this chart bar. Technicians often wait for faster-timeframe momentum to turn back up on a closed bar, and frame risk beyond the pullback low once that low is in place.
- What it does not mean
- Not an instruction, and not proof the histogram is still falling; a turn on an earlier bar no longer shows.
- Check yourself
- How many chart bars has this pullback lasted so far?
▼ SHORT TIMING NOW
MTF table, Timing row
Momentum turned down
- What it measures
- Committed Phase TF (4H) phase is BEAR RALLY, and on the live chart bar the histogram is below the previous bar, which was above the bar before it.
- Technical setup
- The turn that can end a bounce in a downtrend: the chart histogram has started falling again. Technicians usually wait for the chart bar to close with the turn intact, and frame risk beyond the bounce high or as an ATR multiple.
- What it does not mean
- Not a closed-bar reading; it can disappear before the chart bar closes.
- Check yourself
- Has the chart bar closed with the turn still in place?
wait chart hist turn ▼
MTF table, Timing row
Downtrend, bouncing
- What it measures
- Committed Phase TF (4H) phase is BEAR RALLY, but the chart-timeframe histogram has not made a one-bar down-turn on the current bar.
- Technical setup
- A bounce inside a downtrend on the Phase TF, with no histogram turn on this chart bar. Technicians often wait for faster-timeframe momentum to turn back down on a closed bar, and frame risk beyond the bounce high once that high is in place.
- What it does not mean
- Not an instruction, and not proof the histogram is still rising; a turn on an earlier bar no longer shows.
- Check yourself
- How many chart bars has this bounce lasted so far?
—
MTF table, Timing row
No reading
- What it measures
- Committed Phase TF (4H) phase is neither BULL PB nor BEAR RALLY, so the chart histogram turn is not checked.
- What it does not mean
- Not a sideways reading; the 4H phase may be a clear trend.
- Check yourself
- What does the pane background colour show?
⚠ chart TF ≥ phase TF — view lower TF
MTF table, bottom row
Not a trend reading
- What it measures
- The chart timeframe is the same as or above the Phase TF (default 4H). Every reading still calculates.
- What it does not mean
- Not an error; values still draw, but the histogram turn uses a slow chart.
- Check yourself
- Is the chart on a timeframe below the Phase TF?
Teal background
MACD Phase pane background
Uptrend
- What it measures
- Committed Phase TF (4H) phase is EST BULL: 4H PPO +0.10% or more and above its signal line, daily PPO above zero, on closed bars, held 2 chart bars.
- Technical setup
- Trend continuation on the Phase TF, with the daily regime on the same side. Technicians often wait for a pullback within the trend to end, and frame risk beyond the last swing low or as an ATR multiple.
- What it does not mean
- Not the 4H table row; that row has no confirm delay and can differ briefly.
- Check yourself
- Does the 4H table row show the same phase?
Cyan background
MACD Phase pane background
Uptrend, emerging
- What it measures
- Committed Phase TF (4H) phase is EMRG BULL: 4H PPO +0.10% or more and above its signal line, daily PPO zero or below, on closed bars, held 2 chart bars.
- Technical setup
- A possible early regime change, or a counter-trend move: the Phase TF reads up while the daily PPO is still at or below zero. Technicians often wait for the daily to cross zero or a first pullback to hold, framing risk beyond the swing low.
- What it does not mean
- Not agreement with the daily timeframe; the daily PPO is zero or below.
- Check yourself
- Is the daily row still reading down?
Light green background
MACD Phase pane background
Uptrend, pulling back
- What it measures
- Committed Phase TF (4H) phase is BULL PB: 4H PPO +0.10% or more but at or below its signal line, latest PPO peak not lower than the one before. Closed bars, held 2 chart bars.
- Technical setup
- Trend continuation after a pullback on the Phase TF. Technicians often wait for the chart histogram to turn up on a closed bar, the turn this tool marks with a triangle, and frame risk beyond the pullback low or as an ATR multiple.
- What it does not mean
- Not a new downtrend; the 4H PPO is still above zero.
- Check yourself
- Has a ▲ triangle printed, and has its bar closed?
Orange background
MACD Phase pane background
Uptrend, slowing
- What it measures
- Committed Phase TF (4H) phase is WEAK BULL: 4H PPO +0.10% or more but at or below its signal line, latest PPO peak lower than the one before. Closed bars, held 2 chart bars.
- Technical setup
- Momentum fading in an uptrend on the Phase TF: a lower PPO peak. Technicians often read this as a warning rather than a plain pullback, wait for a cross above the signal or a drop below zero, and frame risk closer to the recent swing.
- What it does not mean
- Not a downtrend; easy to confuse with the coral WEAK BEAR tint.
- Check yourself
- Is the 4H PPO above or below zero?
Red background
MACD Phase pane background
Downtrend
- What it measures
- Committed Phase TF (4H) phase is EST BEAR: 4H PPO -0.10% or less and at or below its signal line, daily PPO zero or below, on closed bars, held 2 chart bars.
- Technical setup
- Trend continuation on the Phase TF, with the daily regime on the same side. Technicians often wait for a bounce within the trend to end, and frame risk beyond the last swing high or as an ATR multiple.
- What it does not mean
- Not a forecast; it describes closed 4H bars after a brief confirm delay.
- Check yourself
- Does the 4H table row show the same phase?
Lavender background
MACD Phase pane background
Downtrend, emerging
- What it measures
- Committed Phase TF (4H) phase is EMRG BEAR: 4H PPO -0.10% or less and at or below its signal line, daily PPO above zero, on closed bars, held 2 chart bars.
- Technical setup
- A possible early regime change, or a counter-trend move: the Phase TF reads down while the daily PPO is still above zero. Technicians often wait for the daily to cross zero or a first bounce to fail, framing risk beyond the swing high.
- What it does not mean
- Not agreement with the daily timeframe; the daily PPO is still above zero.
- Check yourself
- Is the daily row still reading up?
Pink background
MACD Phase pane background
Downtrend, bouncing
- What it measures
- Committed Phase TF (4H) phase is BEAR RALLY: 4H PPO -0.10% or less but above its signal line, latest PPO trough not higher than the one before. Closed bars, held 2 chart bars.
- Technical setup
- Trend continuation after a bounce on the Phase TF. Technicians often wait for the chart histogram to turn down on a closed bar, the turn this tool marks with a triangle, and frame risk beyond the bounce high or as an ATR multiple.
- What it does not mean
- Not a new uptrend; the 4H PPO is still below zero.
- Check yourself
- Has a ▼ triangle printed, and has its bar closed?
Coral background
MACD Phase pane background
Downtrend, slowing
- What it measures
- Committed Phase TF (4H) phase is WEAK BEAR: 4H PPO -0.10% or less but above its signal line, latest PPO trough higher than the one before. Closed bars, held 2 chart bars.
- Technical setup
- Momentum fading in a downtrend on the Phase TF: a higher PPO trough. Technicians often read this as a warning rather than a plain bounce, wait for a cross below the signal or a rise above zero, and frame risk closer to the recent swing.
- What it does not mean
- Not an uptrend; easy to confuse with the orange WEAK BULL tint.
- Check yourself
- Is the 4H PPO above or below zero?
Grey background
MACD Phase pane background
Sideways or chop
- What it measures
- Committed Phase TF (4H) phase is CHOP: absolute 4H PPO below 0.10%, or data not yet loaded. Closed bars, held 2 chart bars.
- Technical setup
- A range or a transition on the Phase TF: momentum sits too close to zero for a trend reading. Technicians often wait for the PPO to leave the band with the daily agreeing, and usually frame risk in a range beyond its edges.
- What it does not mean
- Not proof of a range; the pane also starts grey until a first phase commits.
- Check yourself
- Is the 4H PPO near zero, or is history still loading?
Solid teal histogram column
MACD Phase pane, histogram
Leaning up, strengthening
- What it measures
- Chart-timeframe histogram (blue PPO minus orange signal line) is zero or above and higher than the previous bar. Live bar, updates with every tick.
- Technical setup
- Rising momentum on the chart timeframe. Technicians read it against the slower trend: in step with that trend it supports continuation, while a rise inside a downtrend is often only a bounce. Most wait for the bar to close first.
- What it does not mean
- Not the 4H phase; this is the chart timeframe only.
- Check yourself
- Has the chart bar closed with the same colour?
Faded teal histogram column
MACD Phase pane, histogram
Leaning up, slowing
- What it measures
- Chart-timeframe histogram is zero or above but not higher than the previous bar. Live bar, updates with every tick.
- Technical setup
- Momentum above its signal but fading: often the start of a pullback in an uptrend, or the end of a bounce in a downtrend. Technicians usually wait for a closed-bar cross below the signal line before reading it as a turn.
- What it does not mean
- Not a cross below the signal line yet; PPO is still at or above it.
- Check yourself
- Is the histogram still above zero?
Solid red histogram column
MACD Phase pane, histogram
Leaning down, strengthening
- What it measures
- Chart-timeframe histogram (blue PPO minus orange signal line) is below zero and lower than the previous bar. Live bar, updates with every tick.
- Technical setup
- Falling momentum on the chart timeframe. Technicians read it against the slower trend: in step with that trend it supports continuation, while a drop inside an uptrend is often only a pullback. Most wait for the bar to close first.
- What it does not mean
- Not the 4H phase; this is the chart timeframe only.
- Check yourself
- Has the chart bar closed with the same colour?
Faded red histogram column
MACD Phase pane, histogram
Leaning down, slowing
- What it measures
- Chart-timeframe histogram is below zero but not lower than the previous bar. Live bar, updates with every tick.
- Technical setup
- Momentum below its signal but easing: often the late stage of a pullback in an uptrend, or the start of a bounce in a downtrend. Technicians usually wait for a closed-bar cross back above the signal line before reading it as a turn.
- What it does not mean
- Not a cross above the signal line yet; PPO is still below it.
- Check yourself
- Is the histogram still below zero?
Blue line above the grey zero line
MACD Phase pane
Leaning up
- What it measures
- Chart-timeframe PPO, (EMA 12 minus EMA 26) divided by EMA 26 times 100 on close, is above zero. Live bar. It does not feed the phase.
- Technical setup
- Fast average above slow average on the chart timeframe, the basic uptrend condition in MACD terms. Technicians usually check that the slower timeframes agree before reading it as a trend rather than a bounce within a downtrend.
- What it does not mean
- Not the 4H phase; the background and table use other timeframes.
- Check yourself
- Does the pane background agree with the line?
Blue line below the grey zero line
MACD Phase pane
Leaning down
- What it measures
- Chart-timeframe PPO, (EMA 12 minus EMA 26) divided by EMA 26 times 100 on close, is below zero. Live bar. It does not feed the phase.
- Technical setup
- Fast average below slow average on the chart timeframe, the basic downtrend condition in MACD terms. Technicians usually check that the slower timeframes agree before reading it as a trend rather than a pullback within an uptrend.
- What it does not mean
- Not the 4H phase; the background and table use other timeframes.
- Check yourself
- Does the pane background agree with the line?
Orange line
MACD Phase pane
Not a trend reading
- What it measures
- Chart-timeframe signal line: a 9-bar EMA of the blue PPO line. Live bar. The histogram is the gap between the blue and orange lines.
- What it does not mean
- Not the 4H signal line used by the background and the table.
- Check yourself
- Is the blue line above or below it on the closed bar?
▲ teal triangle below the bar
price chart
Momentum turned up
- What it measures
- Committed Phase TF (4H) phase is BULL PB, and the chart histogram's previous bar is lower than both the bar before it and the current bar, on either side of zero. Drawn on the live bar.
- Technical setup
- The pullback-in-an-uptrend pattern: the Phase TF reads a pullback and the chart histogram has turned up. Technicians usually wait for the bar to close with the mark still there, and frame risk beyond the pullback low or as an ATR multiple.
- What it does not mean
- Not a closed-bar mark; it can appear and vanish before the bar closes.
- Check yourself
- Is the triangle still there after the chart bar closed?
▼ red triangle above the bar
price chart
Momentum turned down
- What it measures
- Committed Phase TF (4H) phase is BEAR RALLY, and the chart histogram's previous bar is higher than both the bar before it and the current bar, on either side of zero. Drawn on the live bar.
- Technical setup
- The bounce-in-a-downtrend pattern: the Phase TF reads a bounce and the chart histogram has turned down. Technicians usually wait for the bar to close with the mark still there, and frame risk beyond the bounce high or as an ATR multiple.
- What it does not mean
- Not a closed-bar mark; it can appear and vanish before the bar closes.
- Check yourself
- Is the triangle still there after the chart bar closed?
Phase changed
alert (message: MACD Trend Phase changed)
Not a trend reading
- What it measures
- Fires on the chart bar where the committed Phase TF (4H) phase becomes a different value, after the 2 chart-bar confirm. Any of the nine values counts.
- What it does not mean
- Not directional; the message does not say which phase it changed to.
- Check yourself
- What does the pane background show now?
Major bias changed
alert
Not a trend reading
- What it measures
- Fires when MAJOR moves between three bands: +20% or more, between -20% and +20%, or -20% or less. A change between LEAN and full strength does not fire.
- What it does not mean
- Not a direction call; the message does not name the new reading.
- Check yourself
- Which MAJOR text does the table show now?
Long timing
alert (message: Bull Pullback phase + chart histogram turned up)
Momentum turned up
- What it measures
- Same condition as the ▲ triangle: committed 4H phase BULL PB and a one-bar histogram up-turn on the chart timeframe. Evaluated on the live bar, even with triangles hidden.
- Technical setup
- The same pullback-in-an-uptrend pattern as the up triangle. Alerts like this are often set to Once Per Bar Close so the turn is confirmed on a closed bar, with risk framed beyond the pullback low or as an ATR multiple.
- What it does not mean
- Not a closed-bar event unless the alert is set to Once Per Bar Close.
- Check yourself
- Is the alert set to Once Per Bar Close?
Short timing
alert (message: Bear Rally phase + chart histogram turned down)
Momentum turned down
- What it measures
- Same condition as the ▼ triangle: committed 4H phase BEAR RALLY and a one-bar histogram down-turn on the chart timeframe. Evaluated on the live bar, even with triangles hidden.
- Technical setup
- The same bounce-in-a-downtrend pattern as the down triangle. Alerts like this are often set to Once Per Bar Close so the turn is confirmed on a closed bar, with risk framed beyond the bounce high or as an ATR multiple.
- What it does not mean
- Not a closed-bar event unless the alert is set to Once Per Bar Close.
- Check yourself
- Is the alert set to Once Per Bar Close?
Settings
| Setting | Default | What it changes |
|---|---|---|
| Phase TF (mid) | 4 hours | Timeframe whose phase sets the background colour and triangles |
| Regime TF (slow) | 1 day | Slow layer, only its side of zero is used |
| Chop threshold (|PPO| %) | 0.1 | PPO size below which a timeframe reads CHOP |
| Phase confirm bars | 2 | Chart bars a new phase must hold before changing |
| Major bias threshold (%) | 20 | Net score needed before MAJOR stops reading MIXED |
| Show timing signals on price chart | On | Shows or hides the triangles on the price chart |
All 20 settings, with ranges
| Setting | Default | Range | What it changes |
|---|---|---|---|
| Timeframes | |||
| Regime TF (slow) | 1 day | Timeframe whose closed-bar PPO side of zero splits EMRG from EST | |
| Phase TF (mid) | 4 hours | Timeframe behind the pane background, Timing row, triangles, phase alerts, warning row | |
| MACD engine (PPO-normalized) | |||
| Fast length | 12 | 1 or more | Fast EMA length of the PPO on every timeframe, chart included |
| Slow length | 26 | 1 or more | Slow EMA length of the PPO on every timeframe, chart included |
| Signal length | 9 | 1 or more | EMA length of the signal line on all timeframes but the Regime TF |
| Phase logic | |||
| Chop threshold (|PPO| %) | 0.1 | 0 or more, step 0.05 | Absolute PPO below this reads CHOP on table rows and background |
| Phase confirm bars | 2 | 1 or more | Chart bars a new Phase TF reading must hold before it commits |
| MTF grid (table) | |||
| Grid TF 1 | 30 minutes | Timeframe of table row 1, also counted in MAJOR | |
| Grid TF 2 | 1 hour | Timeframe of table row 2, also counted in MAJOR | |
| Grid TF 3 | 4 hours | Timeframe of table row 3, also counted in MAJOR | |
| Grid TF 4 | 1 day | Timeframe of table row 4, also counted in MAJOR | |
| Weight TF 1 | 1 | 0 or more, step 0.5 | How much row 1 counts in the MAJOR percentage |
| Weight TF 2 | 1.5 | 0 or more, step 0.5 | How much row 2 counts in the MAJOR percentage |
| Weight TF 3 | 2 | 0 or more, step 0.5 | How much row 3 counts in the MAJOR percentage |
| Weight TF 4 | 3 | 0 or more, step 0.5 | How much row 4 counts in the MAJOR percentage |
| Major bias threshold (%) | 20 | 0 to 100 | MAJOR percentage, plus or minus, needed to leave MIXED |
| Strong bias threshold (%) | 50 | 0 to 100 | MAJOR percentage, plus or minus, needed to drop the LEAN prefix |
| Display | |||
| Show MTF table | On | Shows or hides the dashboard table in the indicator pane | |
| Dashboard size | Middle | Tiny, Middle, Large | Table text size: Tiny, Middle (small) or Large (normal) |
| Show timing signals on price chart | On | Shows or hides price-chart triangles; Timing row and alerts unaffected | |
Defaults and ranges as published on TradingView, version 1.0.
Questions worth asking
- When does a triangle appear on the price chart?
- Only while the phase on Phase TF (mid) is BULL PB or BEAR RALLY, and the chart timeframe histogram turns back towards the trend. It marks that momentum turn, and it can change until the chart bar closes.
- What does the percentage in the MAJOR row mean?
- It is a weighted vote. Each grid timeframe scores its phase, higher timeframes count for more by default, and the net is shown as a percentage. By default, under 20% either way reads MIXED, from 20% LEAN BULL or LEAN BEAR, from 50% BULL or BEAR.
- Why does the table tell me to view a lower timeframe?
- The phase is set on Phase TF (mid), 4 hours by default. When the chart timeframe is equal to or above it, a warning row appears. The layout expects a chart below that timeframe, for example 1 hour.
Last tended · Something unclear? Ask in the comments on TradingView (opens in a new tab) · For education only. Not investment advice.