Auto Swing Trade Setup
Rule-based entry zones, an ATR stop and R-multiple reference levels. Levels, not forecasts.
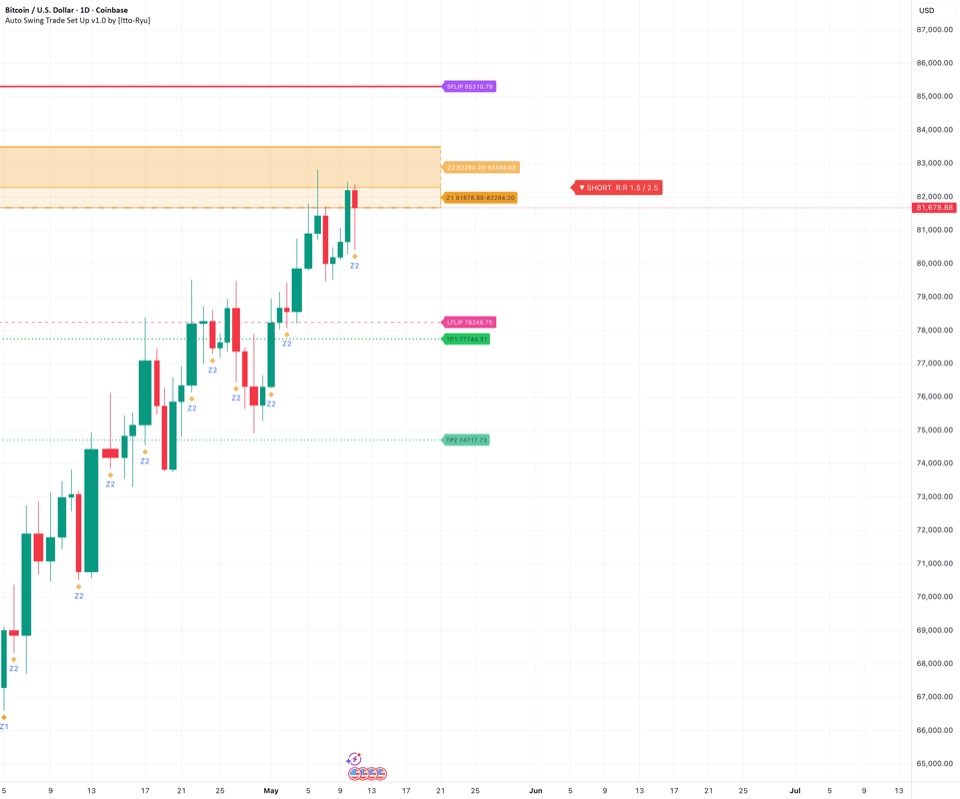
What it draws
- Primary entry zone
- Secondary entry zone
- ATR stop
- Two R-multiple reference levels, 1.5R and 2.5R by default
- Long and short flip lines
How it works
From your chosen direction, it sets a mid line from the 20-period averages, held close to price. Around it, it draws a primary and a secondary entry zone, an ATR-based stop, R-multiple reference levels and two flip lines, all redrawn from the latest close. The levels are arithmetic, not predictions.
How to use
Decide your bias first, from your own analysis. The tool then applies the same arithmetic every time. The levels are redrawn from the latest close on every update, live bar included, so they show where the rules sit now, not a plan fixed in advance.
What it does not do
- It does not choose a direction. You set the bias.
- It does not forecast price. The levels are arithmetic from your inputs (ATR, R).
- It does not know your position or place orders. Switching Direction does not close a trade.
Reading the states
Pick a part of the chart, then a word or mark the tool shows there, to see what it measures in technical terms.Each word or mark the tool shows, grouped by the part of the chart where it appears.
Where on the chart
What it shows
▲ LONG R:R 1.5 / 2.5 (green badge)
price chart, right of the mid line
Not a trend reading
- What it measures
- Repeats your Direction setting and the two ratio inputs (1.5 and 2.5 by default). Nothing on the chart is detected. Drawn on the latest bar only, 25 bars to the right.
- Technical setup
- This setting frames a trend continuation after a pullback. Technicians usually confirm the uptrend on a slower timeframe first, then wait for a pullback towards a moving average. Risk is framed as an ATR multiple beyond the entry zone, with R multiples as reference levels.
- What it does not mean
- Not a detected uptrend or a view on direction. You set it.
- Check yourself
- What did my own analysis say before I chose this setting?
▼ SHORT R:R 1.5 / 2.5 (red badge)
price chart, right of the mid line
Not a trend reading
- What it measures
- Repeats your Direction setting and the two ratio inputs (1.5 and 2.5 by default). Nothing on the chart is detected. Drawn on the latest bar only, 25 bars to the right.
- Technical setup
- This setting frames a trend continuation after a bounce. Technicians usually confirm the downtrend on a slower timeframe first, then wait for a bounce towards a moving average. Risk is framed as an ATR multiple beyond the entry zone, with R multiples as reference levels.
- What it does not mean
- Not a detected downtrend or a view on direction. You set it.
- Check yourself
- Does my own reading of the chart still match this setting?
Thin dotted amber line (no label)
price chart
Not a trend reading
- What it measures
- The mid line. ▲: higher of EMA 20 and SMA 20 of close. Above the latest close it resets to 0.3 ATR below; over 0.7 ATR below, to 0.5 ATR below. ▼ mirrors this above price. Live bar included.
- Technical setup
- In a pullback or bounce setup, a 20-period moving average is a common reference for where the countermove may stall. Technicians often wait for a close back in the trend direction near the average before treating the countermove as over.
- What it does not mean
- Not support or resistance the tool found. It is held close to price.
- Check yourself
- Does this line sit near any level I marked myself?
Z1 [low]-[high], paler amber box with solid border
price chart
Not a trend reading
- What it measures
- A band 0.3 ATR deep beside the mid line on the price side: above it in ▲, below it in ▼. Rebuilt from the latest close on every update, live bar included.
- Technical setup
- In a pullback or bounce setup, the shallow part of the countermove is often treated as the first entry zone. Technicians usually wait for a close back in the trend direction there, with risk framed to a stop an ATR multiple beyond the zone.
- What it does not mean
- Not a fixed zone. It moves with every new price on the live bar.
- Check yourself
- Has this box moved since I last looked at it?
Z2 [low]-[high], stronger amber box with dashed border
price chart
Not a trend reading
- What it measures
- A band 0.6 ATR deep on the far side of the mid line, away from price: below it in ▲, above it in ▼. Rebuilt from the latest close on every update.
- Technical setup
- A deeper second entry zone is a common way to stage a pullback or bounce setup. Technicians usually check that the countermove has not broken the prior swing, and measure the combined risk to the stop in R multiples.
- What it does not mean
- Not a better price, and not a place price is expected to reach.
- Check yourself
- Would price reaching this box change my own view?
Solid amber line above, dashed amber line below
price chart
Not a trend reading
- What it measures
- The outer edges of Z1 and Z2 together. The solid line is always the top edge and the dashed line the bottom edge, in both modes.
- What it does not mean
- The lines reach back 50 bars for display only; the levels did not exist then.
- Check yourself
- Am I reading the back-extended lines as past levels?
SL [price], thick red line
price chart
Not a trend reading
- What it measures
- The mid line minus 1.5 ATR in ▲, plus 1.5 ATR in ▼. It moves whenever the mid line moves, including on the live bar.
- Technical setup
- In pullback or bounce setups, the stop is commonly placed an ATR multiple beyond the entry zone or beyond the last swing, so that ordinary noise is less likely to reach it. The distance from entry to stop defines one R.
- What it does not mean
- Not a level the market is known to respect. It is a fixed ATR distance.
- Check yourself
- Does this distance fit my own risk limit?
TP1 [price], green dotted line
price chart
Not a trend reading
- What it measures
- The mid line plus 1.5 times the red line's distance in ▲, minus in ▼. With default settings that is 2.25 ATR from the mid line.
- Technical setup
- R multiples express a distance as a multiple of the initial risk. Technicians often compare a first R level with prior swing highs or lows in the trend direction, and watch momentum for signs of fading near it.
- What it does not mean
- Not a forecast that price will get there.
- Check yourself
- What levels on my own chart sit between here and the mid line?
TP2 [price], teal dotted line
price chart
Not a trend reading
- What it measures
- The mid line plus 2.5 times the red line's distance in ▲, minus in ▼. With default settings that is 3.75 ATR from the mid line.
- Technical setup
- A larger R multiple assumes an extended trend leg. Technicians usually check that a slower timeframe still agrees with the trend, and how often legs of that size, measured in ATR, have occurred on the same timeframe.
- What it does not mean
- Not a forecast. It is a ratio of the red line's distance.
- Check yourself
- How often has price travelled this far, in ATR, on this timeframe?
SFLIP [price], purple dashed line
price chart
Not a trend reading
- What it measures
- ▲: the mid line plus 2.0 ATR, between the mid line and the green line by default. ▼: the same price as the red line; its label is drawn over the red line's label.
- Technical setup
- Flip levels come from invalidation practice: a close above the line is usually taken to void a downtrend view. With the direction down, it is the stop itself. With the direction up, it sits above price, so a rise through it is no failure.
- What it does not mean
- Not a detected change of trend. A fixed ATR distance only.
- Check yourself
- Has my own reading of the market changed?
LFLIP [price], pink dashed line
price chart
Not a trend reading
- What it measures
- ▼: the mid line minus 2.0 ATR, between the mid line and the green line by default. ▲: the same price as the red line; its label is drawn over the red line's label.
- Technical setup
- Flip levels come from invalidation practice: a close below the line is usually taken to void an uptrend view. With the direction up, it is the stop itself. With the direction down, it sits below price, so a fall through it is no failure.
- What it does not mean
- Not a detected change of trend. A fixed ATR distance only.
- Check yourself
- Would I read the chart the same way without this line?
Amber diamond below the bar, text Z1
price chart, below the bar
Not a trend reading
- What it measures
- The bar's range overlaps Z1 as built from that same bar's close, and the previous bar's did not. Shown in both modes. Can appear and vanish while the bar is live.
- Technical setup
- In a pullback or bounce setup, a move into the first entry zone usually starts the watch rather than confirming anything. Many technicians wait for a close back in the trend direction before treating the countermove as finished.
- What it does not mean
- Not that price touched the box drawn now. Each past bar used its own levels.
- Check yourself
- Has the bar closed, and which levels was it measured against?
Paler amber diamond below the bar, text Z2
price chart, below the bar
Not a trend reading
- What it measures
- The bar's range overlaps Z2 as built from that same bar's close, and the previous bar's did not. In effect the low (▲) or high (▼) reached its own mid line. Live bar can change.
- Technical setup
- In a pullback or bounce setup, a move into the deeper zone is a common checkpoint, not a confirmation. Technicians usually check whether the prior swing still holds and whether a slower timeframe still agrees before treating the trend as intact.
- What it does not mean
- Not that price touched the box drawn now. Each past bar used its own levels.
- Check yourself
- Has the bar closed yet?
Red × below the bar (▲) or above the bar (▼)
price chart
Not a trend reading
- What it measures
- The low crosses below (▲) or the high above (▼) the red line built from that bar's own close, so it sits over 1.5 ATR from that close. Live bar can change.
- Technical setup
- In ATR-based risk framing, a move beyond the stop is where a setup is usually treated as failed. Technicians often separate a wick through the level from a close beyond it. This mark never comes with a close beyond it.
- What it does not mean
- Not that the red line drawn now was reached. Past bars used their own levels.
- Check yourself
- Does the bar's close agree with what its wick did?
Green ▲ above the bar (▲) or green ▼ below the bar (▼)
price chart
Not a trend reading
- What it measures
- The high crosses above (▲) or the low below (▼) the green line built from that bar's own close. Needs over 1.55 ATR from that close by default. Live bar can change.
- Technical setup
- In R-multiple framing, the first reference level is a common point to reassess the trend. Technicians often check momentum, the next swing level and how much open risk remains.
- What it does not mean
- Not that the green line drawn now was reached, and not part of a sequence.
- Check yourself
- Did anything else on my chart change on this bar?
Teal ▲ above the bar (▲) or teal ▼ below the bar (▼)
price chart
Not a trend reading
- What it measures
- The high crosses above (▲) or the low below (▼) the teal line built from that bar's own close. Needs over 3.05 ATR from that close by default. Live bar can change.
- Technical setup
- In R-multiple framing, a larger reference level is usually reached only in an extended trend leg. This mark shows one bar reaching far from its own close, not a leg. Technicians often judge the leg itself from momentum and a slower timeframe.
- What it does not mean
- Not that the teal line drawn now was reached. Past bars used their own levels.
- Check yourself
- How often does a wick this wide appear on this chart?
No lines, boxes, labels or markers
price chart
No reading
- What it measures
- Show Zones is off. No levels, boxes, labels or markers are drawn, and five of the seven alerts cannot fire. The two flip alerts still can.
- What it does not mean
- Not that conditions are quiet. The tool is simply switched off.
- Check yourself
- Did I switch Show Zones off on purpose?
Zone 1 Hit: "Price entered Zone 1 (first fill)"
alert
Not a trend reading
- What it measures
- Same condition as the Z1 diamond: the bar's range overlaps Z1 built from that bar's close, and the previous bar's did not. Checked on the live bar too. Cannot fire when Show Zones is off.
- Technical setup
- In a pullback or bounce setup, an alert at the first entry zone is usually a prompt to look, not a confirmation. Technicians often wait for a close back in the trend direction before treating the countermove as finished.
- What it does not mean
- Not that price reached the box that was on screen when the alert was made.
- Check yourself
- Is the alert set to once per bar close or once per bar?
Zone 2 Hit: "Price entered Zone 2 (averaging zone)"
alert
Not a trend reading
- What it measures
- Same condition as the Z2 diamond: the bar's range overlaps Z2 built from that bar's close, and the previous bar's did not. Checked on the live bar too. Cannot fire when Show Zones is off.
- Technical setup
- In a pullback or bounce setup, a move into the deeper zone is a checkpoint, not a confirmation. Technicians usually recheck the prior swing and the slower timeframe, and measure the combined risk to the stop in R multiples.
- What it does not mean
- Not a suggestion to act. It reports a range overlap with Z2 only.
- Check yourself
- Has the bar closed since the alert arrived?
SL Hit: "STOP LOSS hit — EXIT"
alert
Not a trend reading
- What it measures
- Same as the red ×: the low crosses below (▲) or the high above (▼) the red line built from that bar's close. Checked on the live bar too. Cannot fire when Show Zones is off.
- Technical setup
- In ATR-based risk framing, a move beyond the stop is where a setup is usually treated as failed. Technicians often separate a wick through the level from a close beyond it. This alert never comes with a close beyond it.
- What it does not mean
- Not an instruction. It reports a wide wick against levels built on that bar.
- Check yourself
- Does my own plan define this level, or only the tool?
TP1 Hit: "TP1 hit — close 50%"
alert
Not a trend reading
- What it measures
- Same as the green triangles: the high crosses above (▲) or the low below (▼) the green line built from that bar's close. Checked on the live bar too. Cannot fire when Show Zones is off.
- Technical setup
- In R-multiple framing, the first reference level is a common point to reassess. Technicians often review momentum, the next swing level and how much open risk remains.
- What it does not mean
- Not an instruction. It reports a price cross only.
- Check yourself
- What did my own plan say about this level?
TP2 Hit: "TP2 hit — close remaining"
alert
Not a trend reading
- What it measures
- Same as the teal triangles: the high crosses above (▲) or the low below (▼) the teal line built from that bar's close. Checked on the live bar too. Cannot fire when Show Zones is off.
- Technical setup
- In R-multiple framing, a larger reference level is usually reached only in an extended trend leg. This alert reports one bar reaching far from its own close, not a leg. Technicians often judge the leg itself from momentum and a slower timeframe.
- What it does not mean
- Not an instruction. It reports a price cross only.
- Check yourself
- How far did the bar close from the end of its wick?
Long Flip: "Long signal flipped — re-evaluate"
alert (▲ only, no chart marker)
Not a trend reading
- What it measures
- ▲ only: the high crosses above the purple line (mid line plus 2.0 ATR, so over 1.3 ATR above that bar's close). Still fires with Show Zones off. Checked on the live bar too.
- Technical setup
- In invalidation practice, technicians usually wait for a close above such a line before a downtrend view counts as void. This alert never comes with a close above it, and it fires in the chosen direction, so it is not a reversal.
- What it does not mean
- Not a detected reversal. It fires on a rise, in the direction you chose.
- Check yourself
- Has anything on my own chart actually changed direction?
Short Flip: "Short signal flipped — re-evaluate"
alert (▼ only, no chart marker)
Not a trend reading
- What it measures
- ▼ only: the low crosses below the pink line (mid line minus 2.0 ATR, so over 1.3 ATR below that bar's close). Still fires with Show Zones off. Checked on the live bar too.
- Technical setup
- In invalidation practice, technicians usually wait for a close below such a line before an uptrend view counts as void. This alert never comes with a close below it, and it fires in the chosen direction, so it is not a reversal.
- What it does not mean
- Not a detected reversal. It fires on a fall, in the direction you chose.
- Check yourself
- Has anything on my own chart actually changed direction?
Settings
| Setting | Default | What it changes |
|---|---|---|
| Direction | Long | Side every zone, stop and level is drawn for |
| SL = ATR x | 1.5 | Stop distance from the entry midpoint, in ATR |
| TP1 R:R | 1.5 | First reference level, as a multiple of the risk |
| TP2 R:R | 2.5 | Second reference level, as a multiple of the risk |
| Flip = ATR x | 2 | ATR distance of the flip line not tied to the stop |
| Zone 1 width (ATR x) | 0.3 | Depth of the primary entry zone, in ATR |
All 12 settings, with ranges
| Setting | Default | Range | What it changes |
|---|---|---|---|
| Trade Direction | |||
| Direction | Long | Long, Short | Mirrors all levels: mid line at or below the close (▲), above (▼) |
| Show Zones | On | Turns all lines, boxes, labels, markers and five of seven alerts on or off | |
| Risk Settings | |||
| SL = ATR x | 1.5 | 0.5 or more, step 0.1 | Red line's ATR distance from mid line; green, teal and one flip line follow |
| TP1 R:R | 1.5 | 1 or more, step 0.1 | Green line's distance, as a multiple of the red line's distance |
| TP2 R:R | 2.5 | 1 or more, step 0.1 | Teal line's distance, as a multiple of the red line's distance |
| Flip = ATR x | 2 | 1 or more, step 0.1 | ATR distance of the purple (▲) or pink (▼) line from mid line |
| Line Length (bars) | 50 | 10 to 200 | How many bars back from the latest bar the lines and boxes start |
| Zone 1 width (ATR x) | 0.3 | 0.1 or more, step 0.1 | Depth of the Z1 box in ATR, on the price side of mid line |
| Zone 2 width (ATR x) | 0.6 | 0.2 or more, step 0.1 | Depth of the Z2 box in ATR, beyond the mid line from price |
| Reference Indicators | |||
| EMA Fast (entry ref) | 20 | EMA length on close, one of two candidates for the mid line | |
| BB Length (entry ref) | 20 | SMA length on close, the other mid line candidate; no bands drawn | |
| ATR Length | 14 | ATR period behind every distance, including the mid line's clamp | |
Defaults and ranges as published on TradingView, version 1.0.
Questions worth asking
- Why does the badge say LONG before I have decided anything?
- The badge repeats the Direction setting, which is Long by default. It is not a reading of the market, and the R:R figures beside it come from your settings. Set Direction to Short and every zone, stop and level is redrawn for that side.
- How are the entry zones placed?
- For Long the midpoint is the higher of the fast EMA and the Bollinger basis, both 20 periods by default. For Short it is the lower. It then keeps the midpoint within a set ATR distance of the close, and both zones are measured from it.
- Why have the zones moved since I made my plan?
- The levels recompute live on each bar from the current close, EMA, Bollinger basis and ATR. The tool keeps no record of the bar where you made your plan, so the drawn levels can move away from the ones you noted.
Last tended · Something unclear? Ask in the comments on TradingView (opens in a new tab) · For education only. Not investment advice.